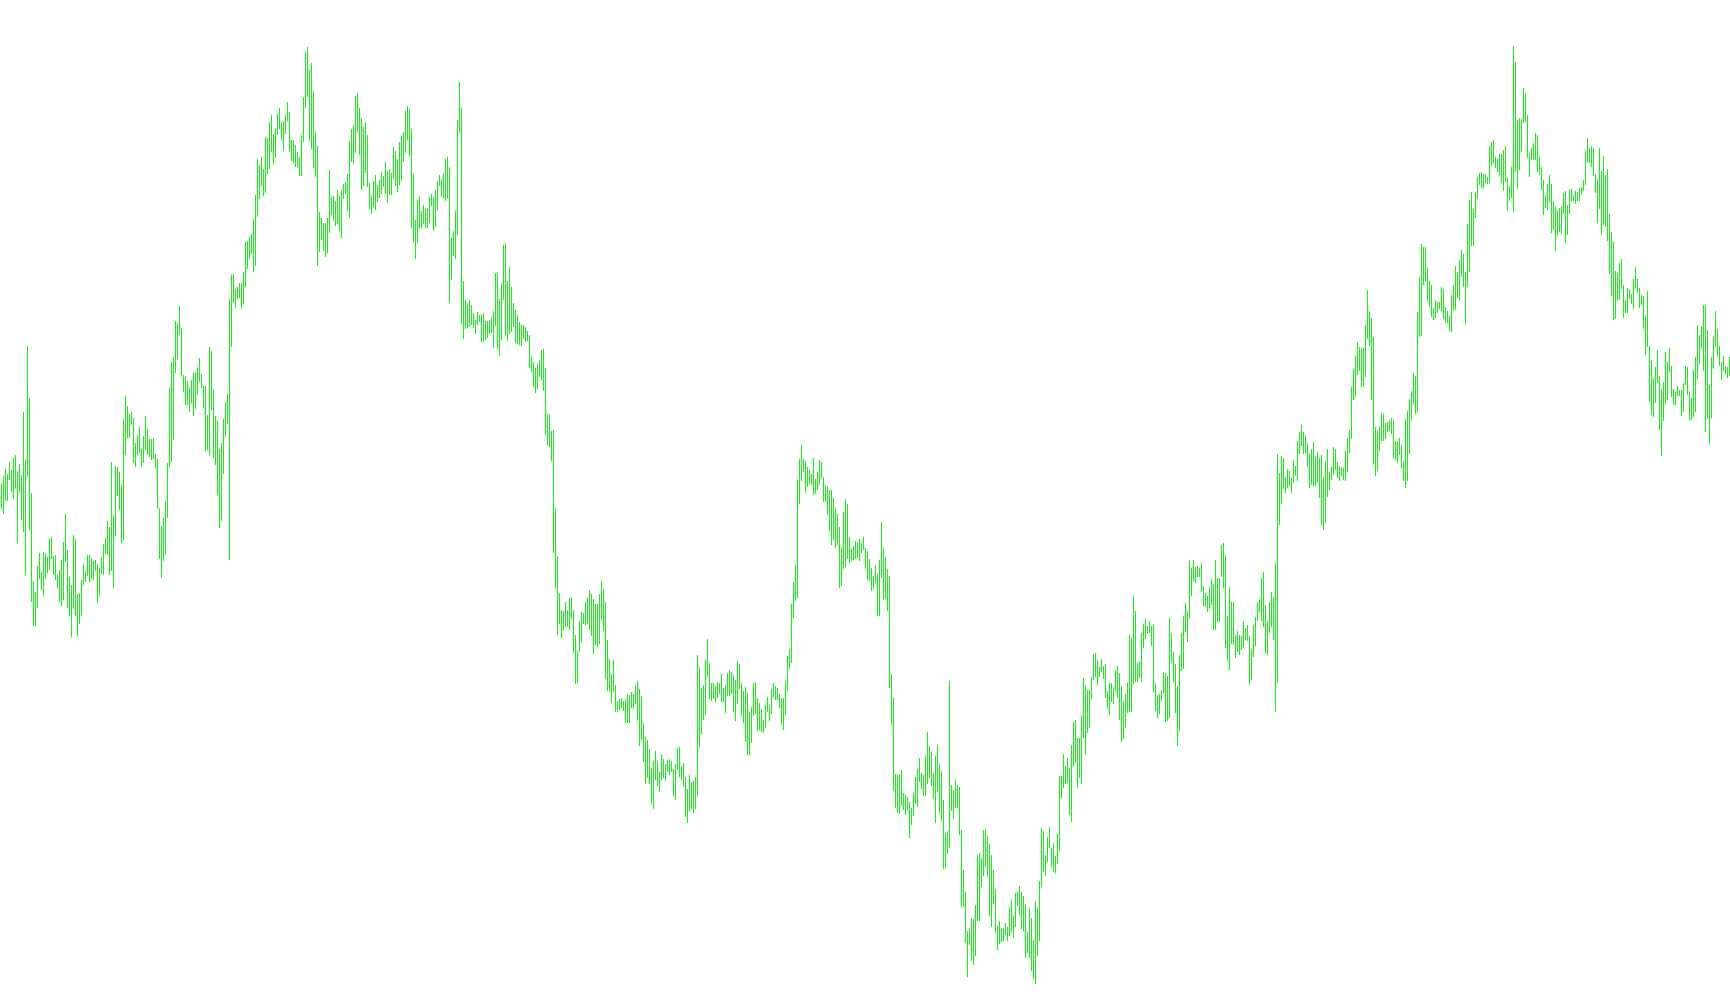
This script is a specialized technical analysis tool designed for the MetaTrader trading platform. Its primary purpose is to visually signal potential shifts in market momentum by identifying specific conditions where price action, trend strength, and overbought/oversold levels intersect.
Core Logic Overview
The tool monitors the market using three distinct layers of data: Moving Averages (to determine trend direction), the Relative Strength Index (RSI) (to identify overextended prices), and a comparative calculation between two different moving average speeds.
How the Signals Work
The logic categorizes market behavior into four distinct visual signals, represented as histograms on a separate window:
1. Strong Sell Signals The script looks for a specific "exhaustion" point in an upward move. It triggers this signal when:
- The RSI indicates the market is in an overbought state (exceeding 75) but has started to turn downward.
- Simultaneously, a faster-moving average drops below a slightly slower one, confirming that downward momentum is gaining strength.
2. Strong Buy Signals Conversely, the script identifies "bottoming out" in a downward move. It triggers this signal when:
- The RSI indicates the market is in an oversold state (dropping below 25) but has begun to curve upward.
- At the same time, a faster-moving average rises above a slightly slower one, confirming that upward momentum is taking hold.
3. Weak Sell Signals When the market is not in an extreme overbought or oversold zone, the script monitors the general trend. If there are no "strong" signals present:
- It identifies a "weak sell" if the primary moving average remains higher than its comparative counterpart. This suggests a general bearish tilt in the current environment.
4. Weak Buy Signals Similarly, in a neutral market environment:
- It identifies a "weak buy" if the primary moving average falls below its comparative counterpart. This indicates a general bullish tilt or a prevailing upward bias.
Customization Options
To suit different trading styles, the script allows users to adjust several key parameters:
- Timeframe: Choose the specific minute interval for analysis.
- Moving Average Period: Define how many bars are used to calculate the trend (with a safety floor of 4).
- RSI Period: Adjust the sensitivity of the overbought/oversold measurements.
- Calculation Mode: Switch between different types of moving averages (such as Simple, Exponential, or Weighted) to change how quickly the script reacts to new price data.
- Price Source: Choose which price point to track (e.g., Close, Open, High, Low, or Median).
//+------------------------------------------------------------------+
//|                                  Áîëüøàÿ Êîëëåêöèÿ Ñåìàôîðîâ.mq4 |
//+------------------------------------------------------------------+
#property copyright "Ñåðãååâ Àëåêñåé (ñ) 2007"

#property indicator_separate_window
#property indicator_minimum 0
#property indicator_maximum 1
#property indicator_buffers 4
#property indicator_width1 2
#property indicator_width2 2
#property indicator_width3 1
#property indicator_width4 1
#property indicator_color1 Crimson
#property indicator_color2 LimeGreen
#property indicator_color3 Crimson
#property indicator_color4 LimeGreen
#property indicator_style1 STYLE_SOLID
#property indicator_style2 STYLE_SOLID
#property indicator_style3 STYLE_SOLID
#property indicator_style4 STYLE_SOLID
//---- input parameters
extern int     Minutes=0;
extern int     MA=20;
extern int     rsiPeriod=3;
extern int		Mode=MODE_EMA;//0-sma, 1-ema, 2-smma, 3-lwma
extern int		Price=PRICE_MEDIAN;//0-close, 1-open, 2-high, 3-low, 4-median, 5-typic, 6-wieight

//---- buffers
double ExtMapBuffer1[];
double ExtMapBuffer2[];
double ExtMapBuffer3[];
double ExtMapBuffer4[];

int init()
{
//---- indicators
	SetIndexStyle(0,DRAW_HISTOGRAM);	SetIndexBuffer(0,ExtMapBuffer1);
	SetIndexStyle(1,DRAW_HISTOGRAM);	SetIndexBuffer(1,ExtMapBuffer2);
	SetIndexStyle(2,DRAW_HISTOGRAM);	SetIndexBuffer(2,ExtMapBuffer3);
	SetIndexStyle(3,DRAW_HISTOGRAM);	SetIndexBuffer(3,ExtMapBuffer4);

   string Name = "Black("+MA+","+rsiPeriod+")";
   IndicatorShortName(Name);

	return(0);
}
int deinit()  { return(0); }

int start()
{
   double rs, rf, rsi, rsiPre;
//----
	if (MA<4) MA = 4;

	for (int i = 0; i <= Bars; i++)
	{
		ExtMapBuffer1[i]=0;
		ExtMapBuffer2[i]=0;
		ExtMapBuffer3[i]=0;
		ExtMapBuffer4[i]=0;

		rs=iMA(NULL, Minutes, MA, 0, Mode, Price, i);
		rf=iMA(NULL, Minutes, MA-3, 0, Mode, Price, i);

		rsi = iRSI(NULL, Minutes, rsiPeriod, Price, i);
		rsiPre = iRSI(NULL, Minutes, rsiPeriod, Price, i+1);

		if ((rsiPre>75) && (rsi<rsiPre) && (rf<rs))  ExtMapBuffer1[i] = 1;//ïðîäàåì
		if ((rsiPre<25) && (rsi>rsiPre) && (rf>rs))  ExtMapBuffer2[i] = 1;//ïîêóïàåì

		if (ExtMapBuffer1[i]==0 && ExtMapBuffer2[i] == 0)
		{
			if (rs>rf) ExtMapBuffer3[i]=1; // ïðîäàåì ñëàáî
			if (rs<rf) ExtMapBuffer4[i]=1; // ïîêóïàåì ñëàáî
		}
	}
	return(0);
}
//+------------------------------------------------------------------+
Comments