#(SF_TREND_LINES_ALL)
Download script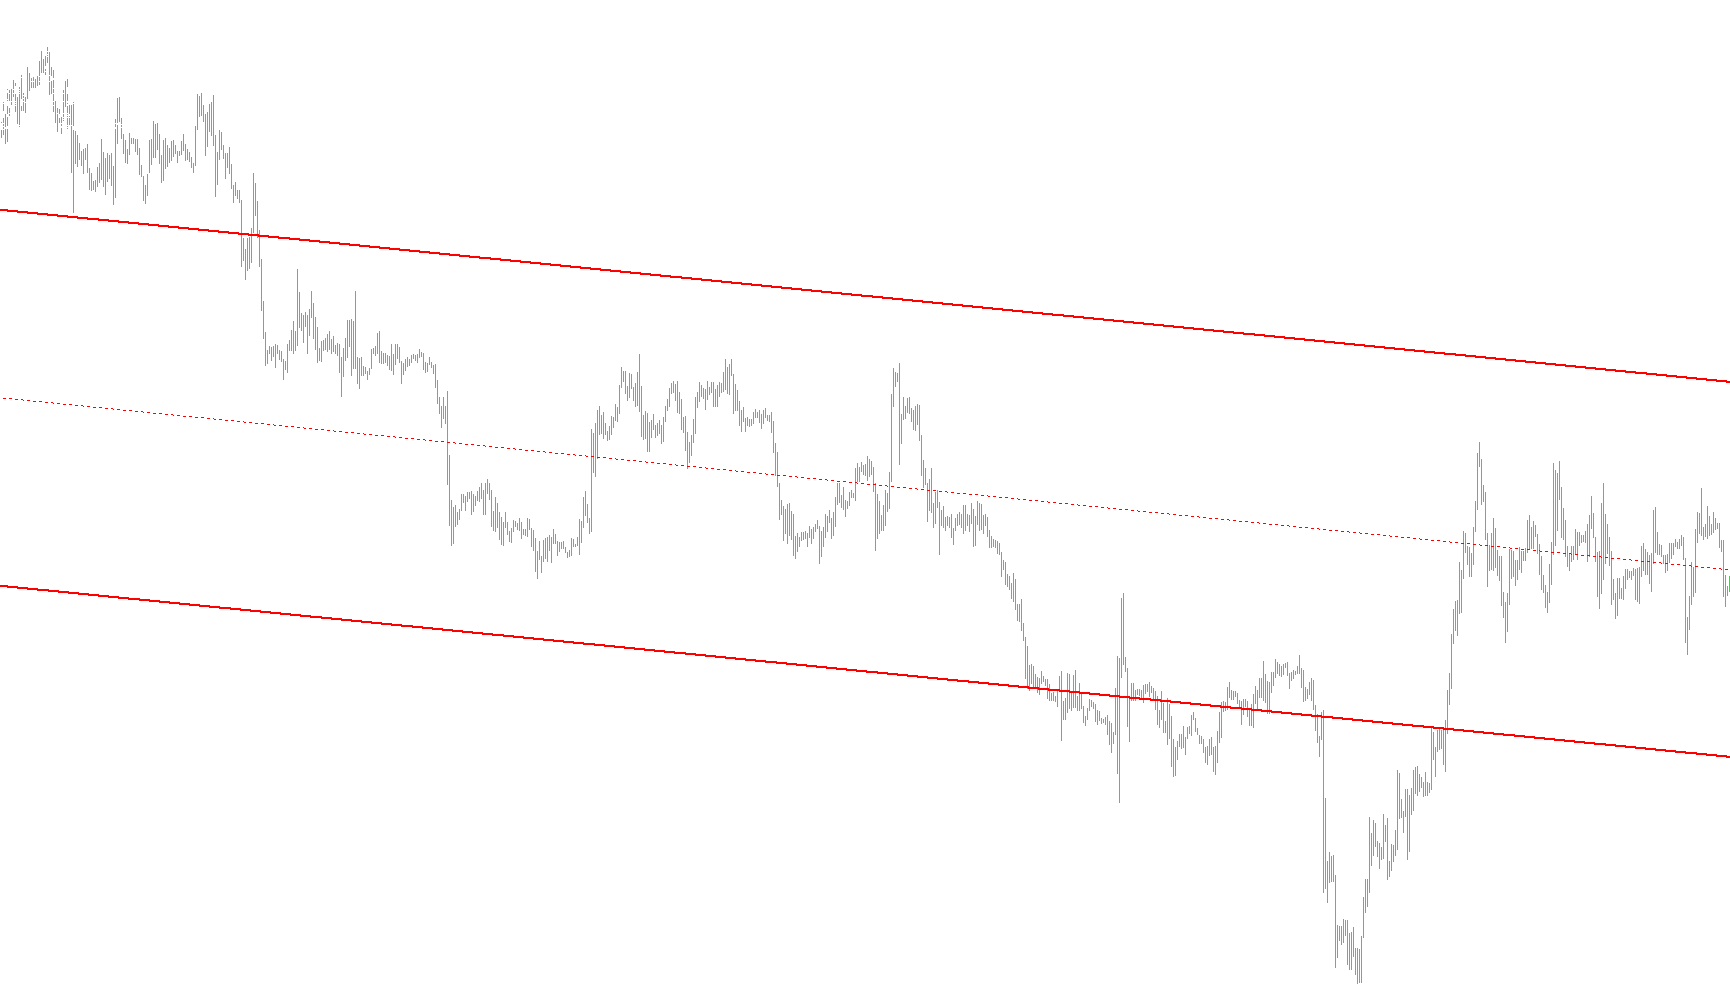
This tool is designed to enhance your trading charts by providing a comprehensive multi-timeframe perspective of market trends. Instead of forcing you to manually switch between different timeframes to see the "big picture," this script automatically integrates trend line data from multiple periods into a single, unified view.
Core Functionality
The primary logic of the script is built around Multi-Timeframe Analysis. It scans various chronological scales—ranging from fast-moving 1-minute intervals to long-term Monthly views—and pulls the relevant trend information onto your current active chart. This allows you to see where major price support and resistance levels sit across different horizons simultaneously.
Key Features
- Multi-Timeframe Integration: The script is capable of pulling data from a wide variety of timeframes, including:
- Short-term views (M1, M5, M15, M30)
- Medium-term views (H1, H4)
- Long-term views (Daily, Weekly, and Monthly)
- Customizable Visibility: You have full control over which timeframes are displayed. You can toggle specific periods on or off depending on your trading style. For instance, a scalper might prefer seeing 1-minute and 5-minute trends, while a swing trader might focus exclusively on Daily and Weekly data.
- Visual Organization: To prevent the chart from becoming cluttered or confusing, each timeframe is assigned its own unique color profile. This distinct visual coding makes it easy to identify at a glance which trend line belongs to which time period (e.g., distinguishing a Daily trend from an Hourly trend by their specific colors).
How It Works
When you load the script, it performs a live check of your settings. It then communicates with the underlying trend line engine to fetch the necessary data for every enabled timeframe. By layering this information on your screen, the tool helps you identify "confluence"—points where multiple timeframes align in the same direction—providing a clearer understanding of market momentum and potential price targets.
//+------------------------------------------------------------------+
//|                                           SF_TREND_LINES_ALL.mq4 |
//|                                        Copyright © 2007, LEGRUPO |
//|                                           http://www.legrupo.com |
//+------------------------------------------------------------------+
#property copyright "Copyright © 2007, LEGRUPO"
#property link      "http://www.legrupo.com"

extern bool show_m1_trendlines = false;
extern color m1_line_color = LavenderBlush;

extern bool show_m5_trendlines = false;
extern color m5_line_color = Honeydew;

extern bool show_m15_trendlines = false;
extern color m15_line_color = AntiqueWhite;

extern bool show_m30_trendlines = false;
extern color m30_line_color = LightPink;

extern bool show_H1_trendlines = true;
extern color H1_line_color = Yellow;

extern bool show_H4_trendlines = true;
extern color H4_line_color = Blue;

extern bool show_D1_trendlines = true;
extern color D1_line_color = Red;

extern bool show_W1_trendlines = true;
extern color W1_line_color = DarkOrange;

extern bool show_MN_trendlines = false;
extern color MN_line_color = White;

#property indicator_chart_window
//+------------------------------------------------------------------+
//| Custom indicator initialization function                         |
//+------------------------------------------------------------------+
int init()
  {
//---- indicators
//----
   return(0);
  }
//+------------------------------------------------------------------+
//| Custom indicator deinitialization function                       |
//+------------------------------------------------------------------+
int deinit()
  {
//----

//----
   return(0);
  }
//+------------------------------------------------------------------+
//| Custom indicator iteration function                              |
//+------------------------------------------------------------------+
int start()
  {
   ObjectsDeleteAll();
   if (show_m1_trendlines) {
      double m1_trendline = iCustom(NULL,1,"#(SF_TREND_LINES)",m1_line_color,240,0,0,0);
   }
   if (show_m5_trendlines) {
      double m5_trendline = iCustom(NULL,5,"#(SF_TREND_LINES)",m5_line_color,240,0,0,0);
   }
   if (show_m15_trendlines) {
      double m15_trendline = iCustom(NULL,15,"#(SF_TREND_LINES)",m15_line_color,240,0,0,0);
   }
   if (show_m30_trendlines) {
      double m30_trendline = iCustom(NULL,30,"#(SF_TREND_LINES)",m30_line_color,240,0,0,0);
   }
   if (show_H1_trendlines) {
      double H1_trendline = iCustom(NULL,60,"#(SF_TREND_LINES)",H1_line_color,240,0,0,0);
   }
   if (show_H4_trendlines) {
      double H4_trendline = iCustom(NULL,240,"#(SF_TREND_LINES)",H4_line_color,240,0,0,0);
   }
   if (show_D1_trendlines) {
      double D1_trendline = iCustom(NULL,1440,"#(SF_TREND_LINES)",D1_line_color,240,0,0,0);
   }
   if (show_W1_trendlines) {
      double W1_trendline = iCustom(NULL,10080,"#(SF_TREND_LINES)",W1_line_color,240,0,0,0);
   }
   if (show_MN_trendlines) {
      double MN_trendline = iCustom(NULL,43200,"#(SF_TREND_LINES)",MN_line_color,240,0,0,0);
   }
   int    counted_bars=IndicatorCounted();
//----

//----
   return(0);
  }
//+------------------------------------------------------------------+
Comments