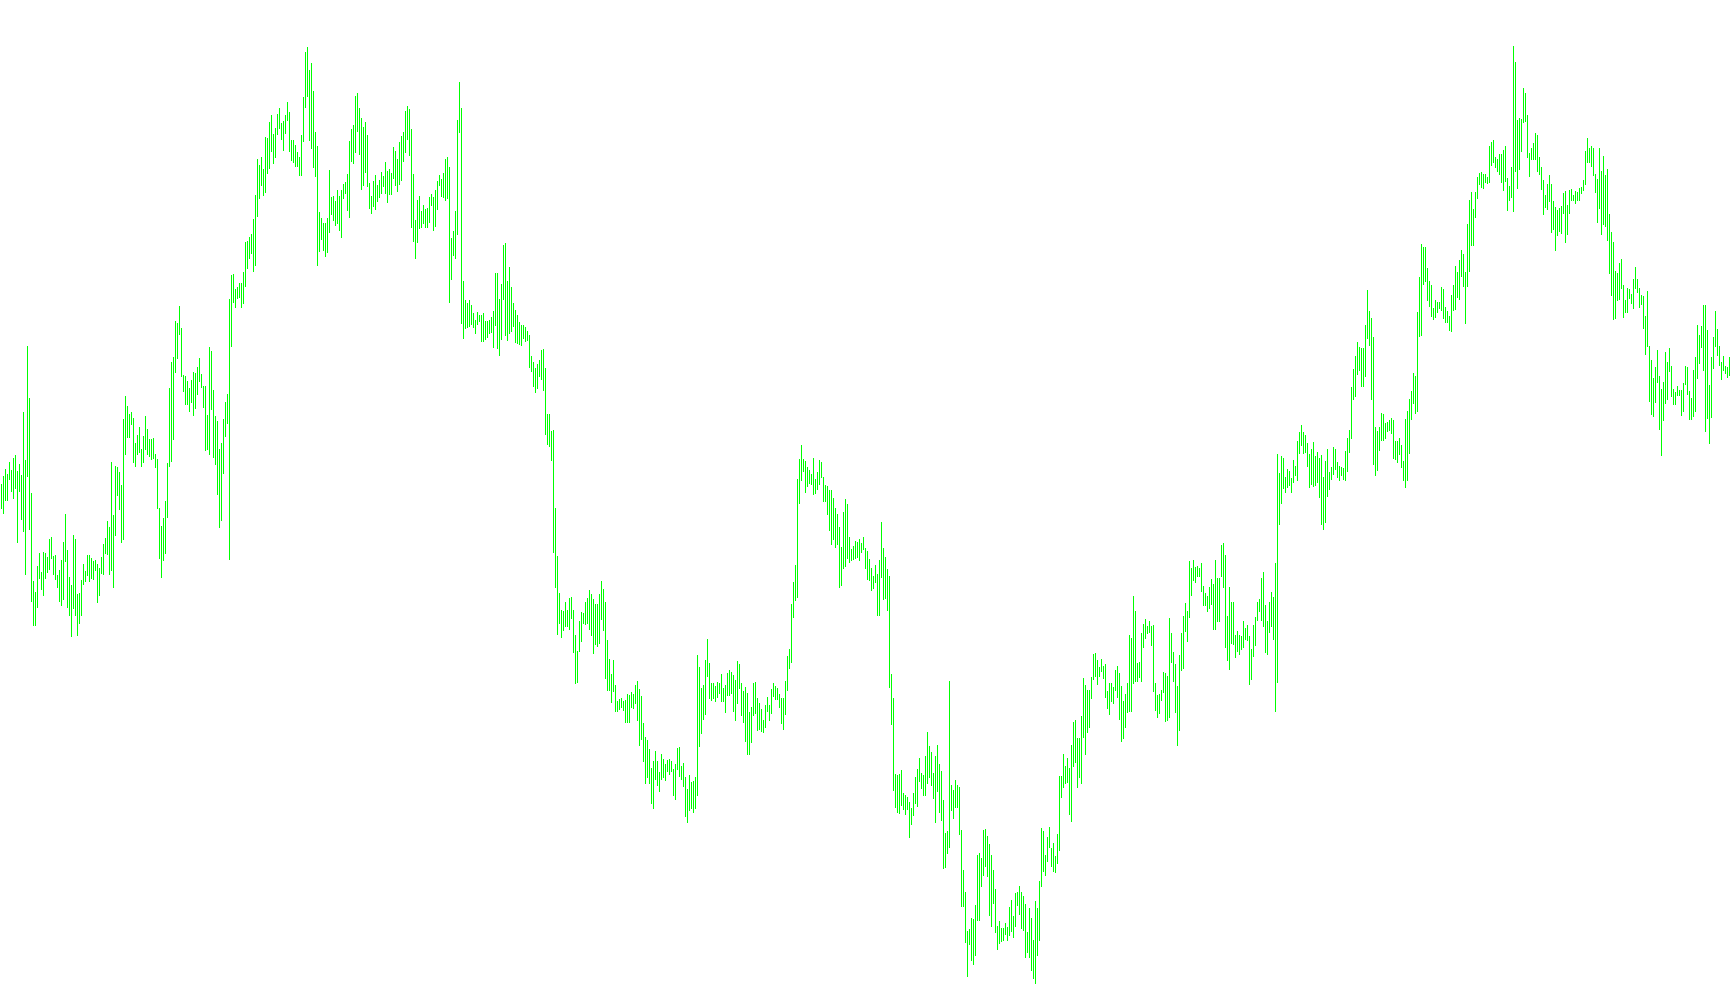
This specialized indicator for MetaTrader 4 is designed to provide a unique visual representation of price action by highlighting specific "shadow" segments and candle bodies over a historical timeframe. Rather than simply displaying standard candlesticks, it creates custom graphical overlays that help traders visualize specific price movements.
Core Functionality
The script functions by analyzing a user-defined period of historical data (the number of candles) and identifying specific price points to draw two distinct geometric shapes for each candle:
- Body Representation: It identifies the main "body" of the price action, coloring it based on whether the price movement was positive or negative.
- Shadow Overlay: It projects a secondary graphical element that acts as a "shadow," emphasizing specific price ranges.
Visual Logic and Customization
The tool organizes the visual data using a clear color-coding system to help traders distinguish between different market sentiments at a glance:
- Bullish Movements: When the price moves upward, the script applies specific colors (such as LightSkyBlue and Blue) to represent the candle and its shadow.
- Bearish Movements: When the price moves downward, it switches to a contrasting color palette (such as SandyBrown and Orange).
Key Technical Behaviors
- Dynamic Range Adjustment: The script calculates the horizontal length of these visual objects based on the timeframe you are currently viewing. This ensures that the "shadow" effect scales correctly whether you are looking at small timeframes or larger ones.
- Automatic Cleanup: To keep your trading chart running smoothly, the script includes a self-cleaning mechanism. When the indicator is removed from the chart, it automatically deletes all the custom shapes it created to prevent clutter and memory usage.
- User-Defined Inputs: The tool allows you to customize the look and feel by adjusting the number of historical candles displayed, the specific timeframe period to analyze, and the exact colors used for both bullish and bearish scenarios.
In summary, this script transforms standard price data into a more vivid, color-coded visual map, making it easier to identify trends and price extremes by emphasizing the relationship between candle bodies and their corresponding shadows.
//+------------------------------------------------------------------+
//|                                                ShadowCandles.mq4 |
//|                            Copyright © 2009, ÏàâåëÈâàíîâè÷ (api) |
//|                                              p231970@hotmail.com |
//+------------------------------------------------------------------+
#property copyright "Copyright © 2009, ÏàâåëÈâàíîâè÷ (api)"
#property link      "p231970@hotmail.com"

#property indicator_chart_window
//---- input parameters
extern int       iPeriod=60;
extern int       iNumCandles=100;
extern color     BullCandle=LightSkyBlue;
extern color     BearCandle=SandyBrown;
extern color     BullShadow=Blue;
extern color     BearShadow=Orange;

double data[][6];

//+------------------------------------------------------------------+
//| Custom indicator deinitialization function                       |
//+------------------------------------------------------------------+
int deinit()
{
   for(int i=0;i<iNumCandles;i++)
   {
      ObjectDelete("ShadowCandle"+i);
      ObjectDelete("ShadowCandleShadow"+i);
   }
   return(0);
}
//+------------------------------------------------------------------+
//| Custom indicator iteration function                              |
//+------------------------------------------------------------------+
int start()
{
   if(iPeriod<=Period()) return(0);

   ArrayCopyRates(data,NULL,iPeriod);
   for(int i=0;i<iNumCandles;i++)
   {
      if(i>0) data[i][5] = data[i-1][0]-60*Period();
      else data[0][5]= data[0][0]+60*(iPeriod-Period());
      DrawCandle(i);
   }
}

void DrawCandle(int bar)
{
   string name1 = "ShadowCandleShadow"+bar;
   string name2 = "ShadowCandle"+bar;
   if(!ObjectCreate(name1,OBJ_RECTANGLE,0,data[bar][0],data[bar][2],data[bar][5],data[bar][3]))
   {
      ObjectSet(name1,OBJPROP_TIME1,data[bar][0]);
      ObjectSet(name1,OBJPROP_TIME2,data[bar][5]);
      ObjectSet(name1,OBJPROP_PRICE1,data[bar][2]);
      ObjectSet(name1,OBJPROP_PRICE2,data[bar][3]);
   }
   ObjectSet(name1,OBJPROP_BACK,false);
   if(!ObjectCreate(name2,OBJ_RECTANGLE,0,data[bar][0],data[bar][1],data[bar][5],data[bar][4]))
   {
      ObjectSet(name2,OBJPROP_TIME1,data[bar][0]);
      ObjectSet(name2,OBJPROP_TIME2,data[bar][5]);
      ObjectSet(name2,OBJPROP_PRICE1,data[bar][1]);
      ObjectSet(name2,OBJPROP_PRICE2,data[bar][4]);
   }
   ObjectSet(name2,OBJPROP_BACK,true);
   if(data[bar][1]<data[bar][4])
   {
      ObjectSet(name1,OBJPROP_COLOR, BullShadow);
      ObjectSet(name2,OBJPROP_COLOR, BullCandle);
   }else
   {
      ObjectSet(name1,OBJPROP_COLOR, BearShadow);
      ObjectSet(name2,OBJPROP_COLOR, BearCandle);
   }
}
//+------------------------------------------------------------------+
Comments