sinc_MA
Download script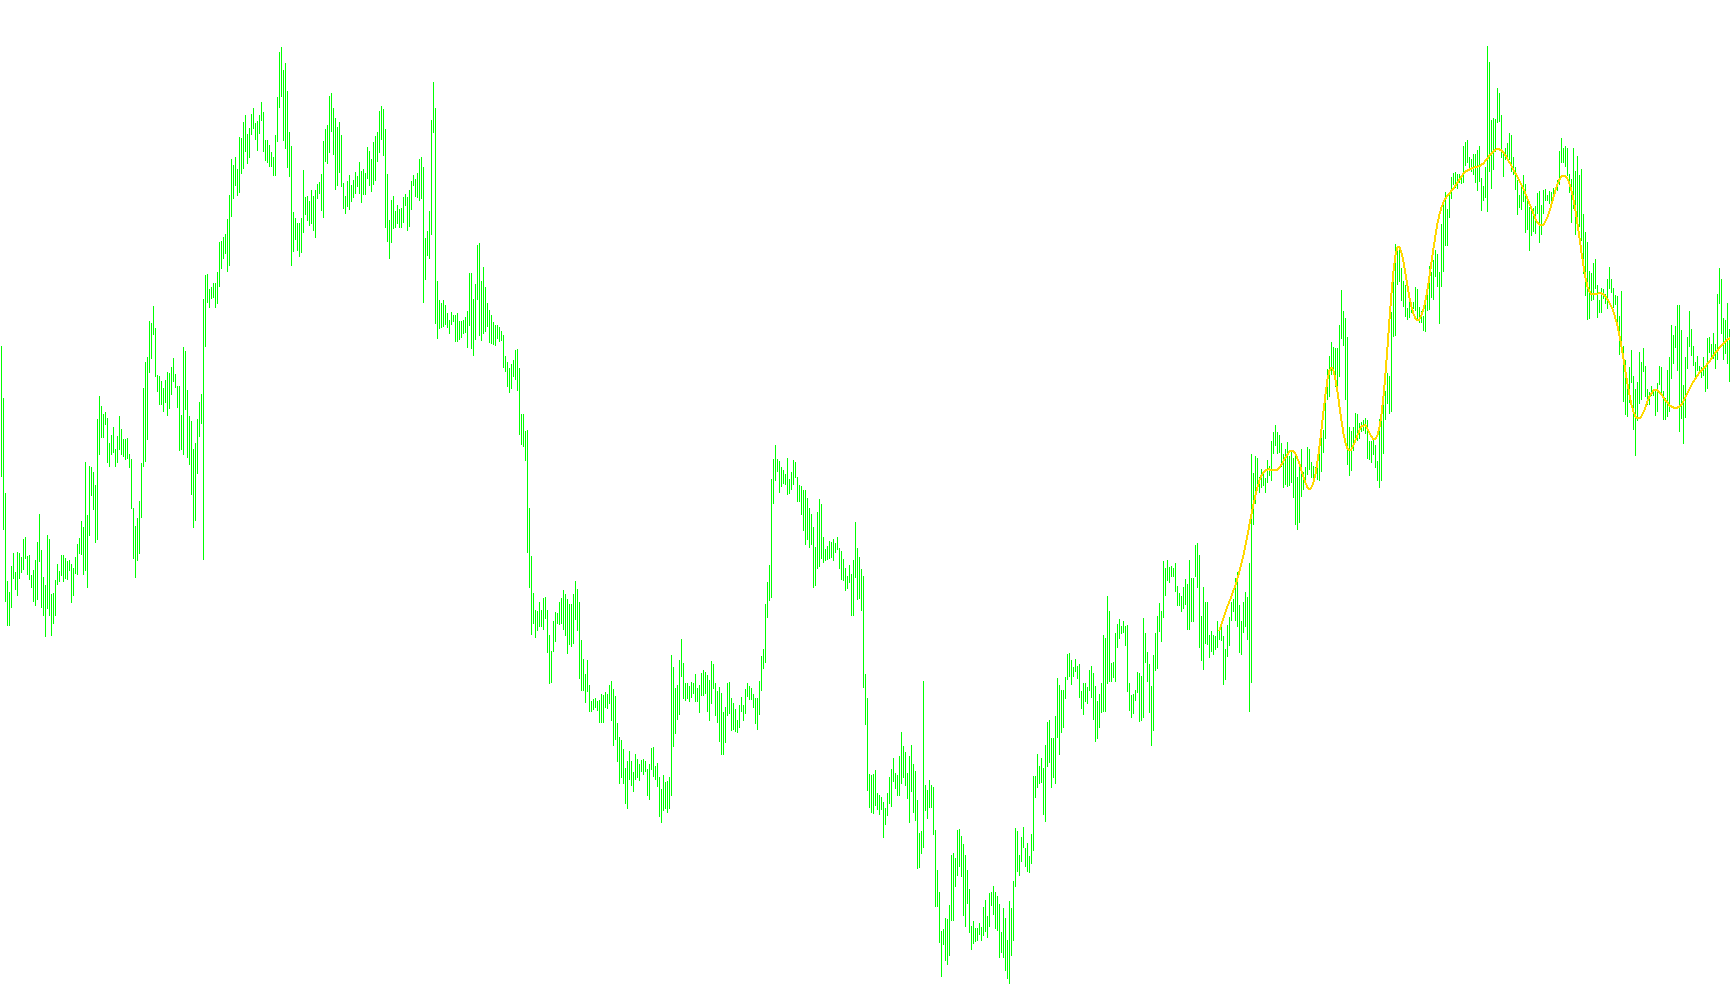
This tool is a specialized technical analysis indicator designed to smooth out price action on a trading chart. Unlike standard moving averages that simply average past prices, this script utilizes a sophisticated mathematical process known as a "Sinc" filter combined with wavelet analysis to identify underlying trends.
How the Logic Works
The core objective of this script is to separate the "signal" (the true trend) from the "noise" (temporary market fluctuations). It achieves this through a multi-step mathematical refinement:
1. Data Preparation and Scaling When the tool starts, it automatically analyzes the amount of historical data available on your chart. It determines an optimal window size—based on your settings—to ensure that the calculation remains consistent regardless of how much data is loaded. It establishes a "baseline" by looking at the price movement over this specific period.
2. Error Detection (The Difference) Instead of trying to plot the price directly, the script calculates the difference between the actual market price and the baseline it just created. By isolating this "difference," the tool can focus specifically on the irregularities and fluctuations in the price movement.
3. Iterative Filtering (The Wavelet Process) This is where the advanced logic resides. The script performs a series of repetitive passes over the data:
- It applies a specialized mathematical wave function (the Sinc function) to the price differences.
- In each pass, it identifies repeating patterns and "ripples" in the data.
- By iterating multiple times, it systematically subtracts these ripples from the price, effectively "cleaning" the data.
- The user can control the intensity of this filtering through the Q (Damping Factor): a higher value allows for more detail/ripple to remain, while a lower value creates a smoother, more generalized trend line.
4. Final Trend Construction After all the cleaning passes are complete, the script adds the refined values back together. The result is a smooth, continuous line that represents the "cleaned" price path.
Key User Benefits
- Noise Reduction: By removing high-frequency fluctuations, the indicator helps traders see the primary direction of the market more clearly.
- Customizable Smoothness: You can adjust how many waves are "truncated" and the damping factor to find the perfect balance between a line that reacts quickly to new news and one that stays steady during choppy markets.
- Dynamic Adaptation: The logic automatically adjusts its internal calculations based on the number of bars you choose to analyze, making it versatile for different timeframes.
//+------------------------------------------------------------------+
//|                                                      sinc_MA.mq4 |
//|                                          Copyright © 2006, gpwr. |
//+------------------------------------------------------------------+
#property copyright "Copyright © 2006, gpwr."
#property indicator_chart_window
#property indicator_buffers 1
#property indicator_color1 Blue
#property indicator_width1 2
//Global constants
#define pi 3.141592653589793238462643383279502884197169399375105820974944592
//Input parameters
extern int    N      =256; // Number of last bars. Must be the power of 2. 0: all data.
extern int    htrun  =3;   // Number of the last wavelets to truncate.
// Damping factor. Higher Q gives more ripple. Q=1 gives sinc function.
extern double Q      =0.5;
//Global variables
int n;
int pwrMax;
//Indicator buffers
double sMA[];
//+------------------------------------------------------------------+
//|                                                                  |
//+------------------------------------------------------------------+
int init()
  {
   if(N <= 0)
       N = Bars;
   n = 1;
   int pwr = 0;
   while(n <= N)
     {
       pwr++;
       n *= 2;
     }
   pwr--;
   n = MathPow(2, pwr);
   Print("pwr=", pwr);
   if(htrun <= 0)
       htrun = 0;
   if(htrun >= pwr)
       htrun = pwr;
   pwrMax = pwr - htrun;
   IndicatorBuffers(1);
   SetIndexBuffer(0, sMA);
   SetIndexStyle(0, DRAW_LINE, STYLE_SOLID, 2);
   IndicatorShortName("sincMA");
   return(0);
  }
//+------------------------------------------------------------------+
//|                                                                  |
//+------------------------------------------------------------------+
int deinit()
  {
    return(0);
  }
//+------------------------------------------------------------------+
//|                                                                  |
//+------------------------------------------------------------------+
//START--------------------------------------------------------------+
int start()
  {
   ArrayInitialize(sMA, EMPTY_VALUE);
   double Fit[], Dif[];
   ArrayResize(Fit, n+1);
   ArrayResize(Dif, n+1);
   for(int i = 0; i <= n; i++)
     {
       Fit[i] = (Close[n] - Close[0])*i / n + Close[0];
       Dif[i] = Close[i] - Fit[i];
       sMA[i] = Fit[i];
     }
   int ss = 2*n; // sampling step
   for(int p = 1; p <= pwrMax; p++)
     {
       ss = ss / 2;
       for(i = 0; i <= n; i++)
         {
           Fit[i] = 0.0;
           for(int j = 1; j <= n / ss; j++)
               Fit[i] += Dif[j*ss - ss / 2]*wave(2*j - 1 - 2.0*i / ss, Q);
         }
       for(i = 0; i <= n; i++)
         {
           Dif[i] -= Fit[i];
           sMA[i] += Fit[i];
         }
     }
   return(0);
  }
//+------------------------------------------------------------------+
//|                                                                  |
//+------------------------------------------------------------------+
//sinc function------------------------------------------------------+
double wave(double x, double Q)
  {
   if(x == 0.0)
       return(1.0);
   else
       return(MathSin(pi*x) / (pi*x) / (x*x + 1)*(Q*x*x + 1));
  }
//+------------------------------------------------------------------+
Comments