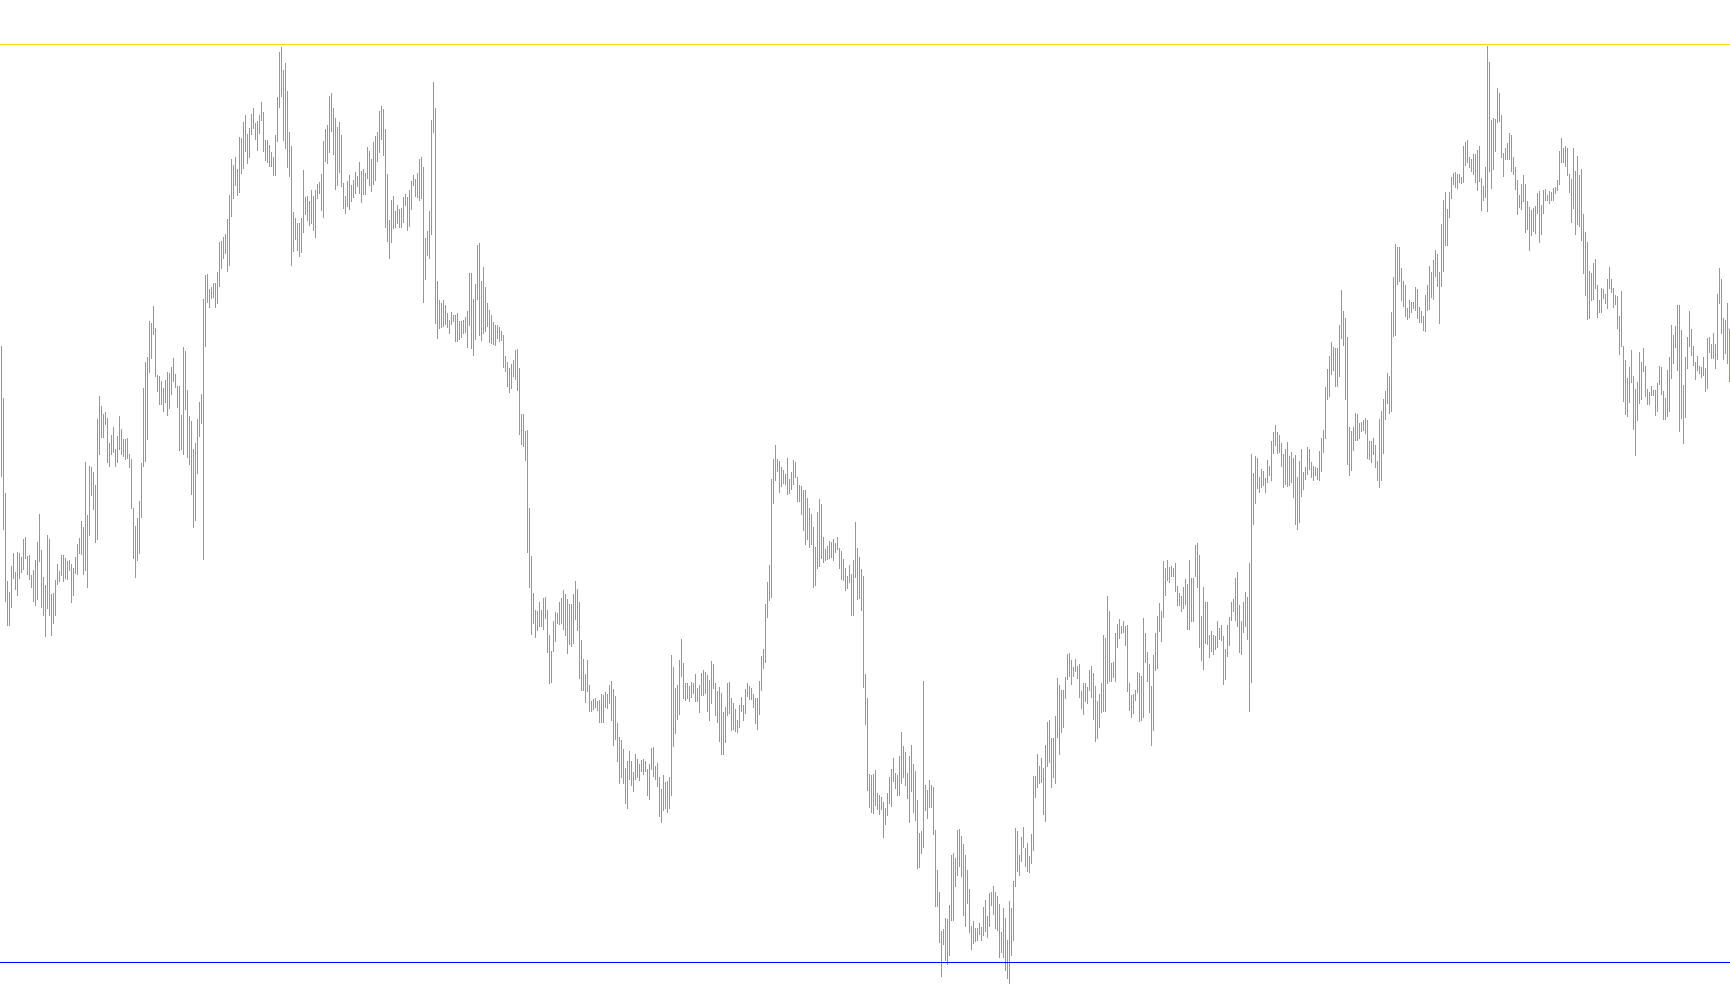
This script is a specialized technical analysis tool designed to identify cyclical patterns in financial markets. Based on the principles of cybernetics, it aims to filter out market "noise" to reveal the underlying rhythmic movements—specifically sine waves—that often govern price action over time.
Core Logic and Mechanism
1. Data Smoothing and Signal Extraction The algorithm begins by calculating a weighted average of the market's high and low prices. Instead of looking at raw, erratic price jumps, it creates a "Smooth" data set. This helps the tool identify the general momentum of the market while ignoring minor fluctuations that don't represent a significant trend change.
2. Cycle Detection Once the data is smoothed, the script applies a recursive mathematical formula to detect cycles. It treats the market movement as a repeating wave. By analyzing the relationship between current prices and historical data points, the tool calculates the frequency and phase of these cycles. This allows it to determine where the market is currently positioned within its larger "wave" (e.g., whether it is currently in an upward swing, a downward swing, or transitioning between them).
3. Sine Wave Generation The primary output of this logic is the creation of two distinct sine waves:
- The Primary Sine Wave: Represents the current detected cycle phase.
- The Lead Sine Wave: This is a "leading" indicator that operates at a slight offset from the primary wave. Because it is mathematically projected slightly ahead, it is intended to provide an early visual cue of potential shifts in the market's direction before they fully manifest in the price action.
4. Support and Resistance Identification A key feature of this script is its ability to automatically identify structural turning points. The logic monitors the interaction between the Primary Sine Wave and the Lead Sine Wave:
- Support Levels: When the Lead Sine Wave crosses above the Primary Sine Wave, the script identifies a potential shift in momentum and draws a green trend line on the chart, suggesting a potential support area or upward movement.
- Resistance Levels: Conversely, when the Lead Sine Wave crosses below the Primary Sine Wave, the script identifies a potential downward shift and draws a red trend line, indicating a resistance area or potential price decline.
User Experience Summary
For the end-user, this tool transforms complex rhythmic data into visual cues. Instead of manually trying to guess where a market cycle might turn, the script does the heavy lifting by calculating these cycles mathematically. It provides a visual representation of the "heartbeat" of the market, using the intersection of two waves to highlight specific areas where price trends may encounter resistance or find support.
//+------------------------------------------------------------------+
//|                                                    Sinewave2.mq4 |
//|                                                                  |
//| Sinewave                                                         |
//|                                                                  |
//| Algorithm taken from book                                        |
//|     "Cybernetics Analysis for Stock and Futures"                 |
//| by John F. Ehlers                                                |
//|                                                                  |
//|                                              contact@mqlsoft.com |
//|                                          http://www.mqlsoft.com/ |
//+------------------------------------------------------------------+
#property copyright "Coded by Witold Wozniak"
#property link      "www.mqlsoft.com"

#property indicator_separate_window
#property indicator_buffers 3
#property indicator_color1 Red
#property indicator_color2 Blue
#property indicator_color3 Yellow

#property indicator_minimum -1
#property indicator_maximum 1
#property indicator_level1 0

double Sine[];
double LeadSine[];
double Cycle[];
double Smooth[];
double Resistance[];
extern double Alpha = 0.07;
extern bool   DrawPriceTrendLines = true;
int buffers = 0;
int drawBegin = 0;

double tempReal, rad2Deg, deg2Rad, label;


int init() {
    drawBegin = 8;
    initBuffer(Sine, "Sine", DRAW_LINE);
    initBuffer(LeadSine, "Lead", DRAW_LINE);
    initBuffer(Cycle);
    initBuffer(Smooth);
    initBuffer(Resistance, "ResisT",DRAW_ARROW, STYLE_DASHDOT,1);
    IndicatorBuffers(buffers);
    IndicatorShortName("Sinewave 2[" + DoubleToStr(Alpha, 2) + "]");
    tempReal = MathArctan(1.0);
    rad2Deg = 45.0 / tempReal;
    deg2Rad = 1.0 / rad2Deg;
    return (0);
}


 int deinit()
  {
   for(int i = ObjectsTotal() - 1; i >= 0; i--)
     {
       string label = ObjectName(i);
       if(StringSubstr(label, 0, 18) != "Support Resistance")
           continue;
       ObjectDelete(label);
     }
   return(0);
  }


int start() {
    if (Bars <= drawBegin) return (0);
    int countedBars = IndicatorCounted(), currents;
    if (countedBars < 0) return (-1);
    if (countedBars > 0) countedBars--;
    int s, limit = Bars - countedBars - 1, Flagup,Flagdn;
    currents=s;
    for (s = limit; s >= 0; s--) {
        Smooth[s] = (P(s) + 2.0 * P(s + 1) + 2.0 * P(s + 2) + P(s + 3)) / 6.0;
        Cycle[s] = (1.0 - 0.5 * Alpha) * (1.0 - 0.5 * Alpha) * (Smooth[s] - 2.0 * Smooth[s + 1] + Smooth[s + 2])
            + 2.0 * (1.0 - Alpha) * Cycle[s + 1]
            - (1.0 - Alpha) * (1.0 - Alpha) * Cycle[s + 2];
        double period = iCustom(0, 0, "CyclePeriod", Alpha, 0, s);
        int DCPeriod = MathFloor(period);
        double RealPart = 0.0;
        double ImagPart = 0.0;
        for (int count = 0; count < DCPeriod; count++) {
            RealPart += MathSin(deg2Rad * 360.0 * count / DCPeriod) * Cycle[s + count];
            ImagPart += MathCos(deg2Rad * 360.0 * count / DCPeriod) * Cycle[s + count];
        }
        double DCPhase;
        if (MathAbs(ImagPart) > 0.0000001) {
            DCPhase = rad2Deg * MathArctan(RealPart / ImagPart);
        } else if (MathAbs(ImagPart) <= 0.0000001) {
    	      if (RealPart >= 0.0) {
    	          DCPhase = 90.0;
    	      } else {
    	          DCPhase = -90.0;
    	      }
        }
        DCPhase += 90.0;
        if (ImagPart < 0) {
            DCPhase += 180.0;
        }
        if (DCPhase > 315.0) {
            DCPhase -= 360.0;
        }
        Sine[s] = MathSin(DCPhase * deg2Rad);
        LeadSine[s] = MathSin((DCPhase + 45.0) * deg2Rad);
        if (DCPhase == 180 && LeadSine[s + 1] > 0) {
            LeadSine[s] = MathSin(45 * deg2Rad);
        }
        if (DCPhase == 0 && LeadSine[s + 1] < 0) {
            LeadSine[s] = MathSin(225 * deg2Rad);
        }


        //Attemp to draw a resistance suport line at cross over

        if (DrawPriceTrendLines == true)
            if (LeadSine[s] > Sine[s] && LeadSine[s+1] < Sine[s+1] )
               {

               DrawPriceTrendLines(Time[s], Time[s-9],
                              Low[s], Low[s], Green, STYLE_SOLID);


               }

             if (LeadSine[s] < Sine[s] && LeadSine[s+1] > Sine[s+1] )
               {

               DrawPriceTrendLines(Time[s], Time[s-9],
                              High[s], High[s], Red,STYLE_DOT);


               }


    }


    return (0);
}

double P(int index) {
    return ((High[index] + Low[index]) / 2.0);
}

void initBuffer(double array[], string label = "", int type = DRAW_NONE, int arrow = 0, int style = EMPTY, int width = EMPTY, color clr = CLR_NONE) {
    SetIndexBuffer(buffers, array);
    SetIndexLabel(buffers, label);
    SetIndexEmptyValue(buffers, EMPTY_VALUE);
    SetIndexDrawBegin(buffers, drawBegin);
    SetIndexShift(buffers, 0);
    SetIndexStyle(buffers, type, style, width);
    SetIndexArrow(buffers, arrow);
    buffers++;
}


void DrawPriceTrendLines(datetime x1, datetime x2, double y1,
                        double y2, color lineColor, double style)
  {
   string label = "Support Resistance" + DoubleToStr(x1, 0);
   ObjectDelete(label);
   ObjectCreate(label, OBJ_TREND, 0, x1, y1, x2, y2, 0, 0);
   ObjectSet(label, OBJPROP_RAY, 0);

   ObjectSet(label, OBJPROP_COLOR, lineColor);
   ObjectSet(label, OBJPROP_STYLE, style);
   ObjectSet(label, OBJPROP_WIDTH, 3);
  }
Comments