Slope Direction Line_005
Download script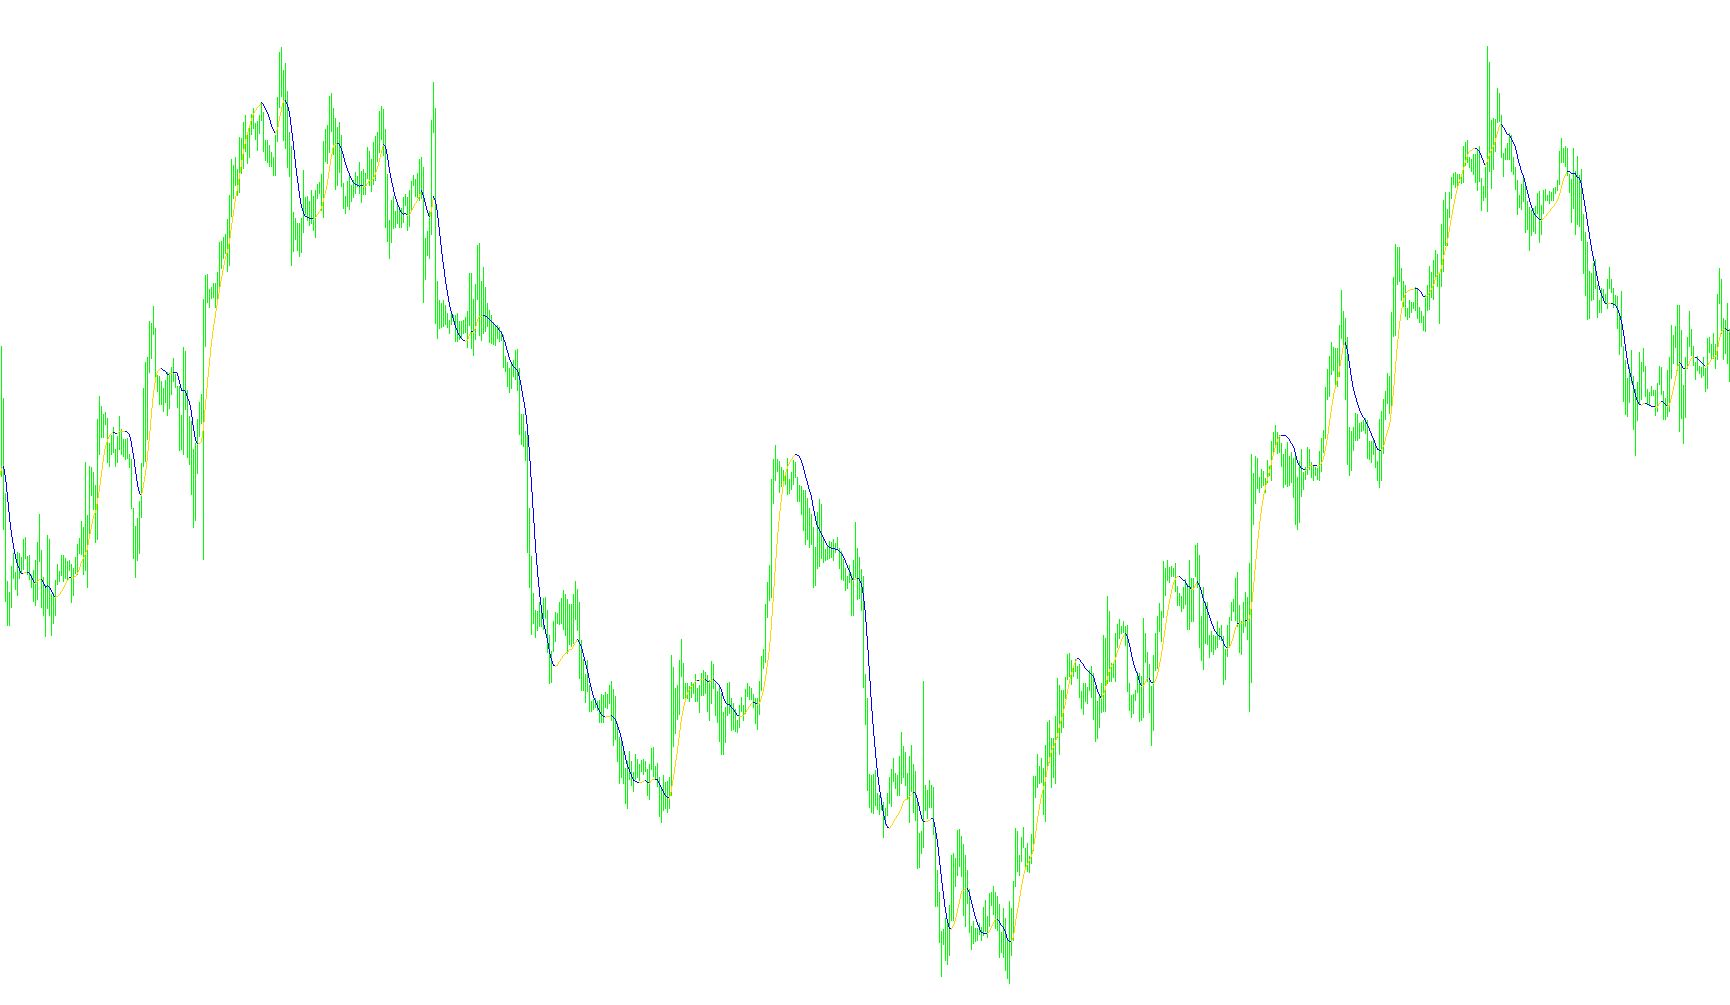
This script is designed to help traders identify and visualize the prevailing direction of a market trend by calculating the "slope" of price movement. Instead of just showing a simple moving average, it processes data in multiple stages to smooth out minor market noise and highlight significant shifts in momentum.
How the Logic Works
1. Data Smoothing and Comparison The tool begins by analyzing two different versions of a weighted moving average simultaneously. One is calculated over a standard period, and the other is calculated over a shorter period (half the length). By comparing these two figures—specifically, doubling the shorter average and subtracting the longer one—the script isolates the velocity of price changes. This mathematical approach helps identify how quickly the market is accelerating or decelerating.
2. Signal Processing Once that velocity is calculated, the script applies a further layer of smoothing using a square-root calculation based on your chosen period. This ensures that the resulting data isn't "jittery" and provides a cleaner look at the underlying trend. It effectively filters out the "white noise" of the market so you can see the broader movement more clearly.
3. Trend Direction Detection The core logic then looks at the change between these smoothed values:
- Upward Movement: If the value increases compared to the previous point, the script identifies an upward trend.
- Downward Movement: If the value decreases compared to the previous point, it identifies a downward trend.
Visual Representation on Your Chart
To make this information easy to read at a glance, the script separates these movements into two distinct visual lines:
- The Uptrend Line (Blue): This line appears only when the logic detects upward momentum. It helps you identify periods where the market is gaining strength.
- The Downtrend Line (Red): This line appears only when the logic detects downward momentum, highlighting periods of selling pressure or decline.
By using this logic, the tool provides a clear visual "map" of the market's direction. Rather than showing you every minor fluctuation, it focuses on confirming where the trend is actually heading, allowing for a cleaner analysis of whether the current market sentiment is bullish or bearish.
//+------------------------------------------------------------------+
//| HMA.mq4
//| Copyright © 2006 WizardSerg <wizardserg@mail.ru>, ?? ??????? ForexMagazine #104
//| wizardserg@mail.ru
//| Revised by IgorAD,igorad2003@yahoo.co.uk |
//| Personalized by iGoR AKA FXiGoR for the Trend Slope Trading method (T_S_T)
//| Link:
//| contact: thefuturemaster@hotmail.com
//+------------------------------------------------------------------+
#property copyright "MT4 release WizardSerg <wizardserg@mail.ru>, ?? ??????? ForexMagazine #104"
#property link      "wizardserg@mail.ru"

#property indicator_chart_window
#property indicator_buffers 2
#property indicator_color1 Blue
#property indicator_color2 Red
//---- input parameters
extern int       period=20;
extern int       method=1;                         // MODE_SMA
extern int       price=0;                          // PRICE_CLOSE
//---- buffers
double Uptrend[];
double Dntrend[];
double ExtMapBuffer[];


//+------------------------------------------------------------------+
//| Custom indicator initialization function                         |
//+------------------------------------------------------------------+
int init()
{
    IndicatorBuffers(3);
    SetIndexBuffer(0, Uptrend);
    //ArraySetAsSeries(Uptrend, true);
    SetIndexBuffer(1, Dntrend);
    //ArraySetAsSeries(Dntrend, true);
    SetIndexBuffer(2, ExtMapBuffer);
    ArraySetAsSeries(ExtMapBuffer, true);

    SetIndexStyle(0,DRAW_LINE,STYLE_SOLID,1);
    SetIndexStyle(1,DRAW_LINE,STYLE_SOLID,1);

    IndicatorShortName("Slope Direction Line("+period+")");
    return(0);
}

//+------------------------------------------------------------------+
//| Custor indicator deinitialization function                       |
//+------------------------------------------------------------------+
int deinit()
{
    // ???? ????? ?????? ??????
    return(0);
}

//+------------------------------------------------------------------+
//| ?????????? ???????                                               |
//+------------------------------------------------------------------+
double WMA(int x, int p)
{
    return(iMA(NULL, 0, p, 0, method, price, x));
}

//+------------------------------------------------------------------+
//| Custom indicator iteration function                              |
//+------------------------------------------------------------------+
int start()
{
    int counted_bars = IndicatorCounted();

    if(counted_bars < 0)
        return(-1);

    int x = 0;
    int p = MathSqrt(period);
    int e = Bars - counted_bars + period + 1;

    double vect[], trend[];

    if(e > Bars)
        e = Bars;

    ArrayResize(vect, e);
    ArraySetAsSeries(vect, true);
    ArrayResize(trend, e);
    ArraySetAsSeries(trend, true);

    for(x = 0; x < e; x++)
    {
        vect[x] = 2*WMA(x, period/2) - WMA(x, period);
 //       Print("Bar date/time: ", TimeToStr(Time[x]), " close: ", Close[x], " vect[", x, "] = ", vect[x], " 2*WMA(p/2) = ", 2*WMA(x, period/2), " WMA(p) = ",  WMA(x, period));
    }

    for(x = 0; x < e-period; x++)

        ExtMapBuffer[x] = iMAOnArray(vect, 0, p, 0, method, x);

    for(x = e-period; x >= 0; x--)
    {
        trend[x] = trend[x+1];
        if (ExtMapBuffer[x]> ExtMapBuffer[x+1]) trend[x] =1;
        if (ExtMapBuffer[x]< ExtMapBuffer[x+1]) trend[x] =-1;

    if (trend[x]>0)
    { Uptrend[x] = ExtMapBuffer[x];
      if (trend[x+1]<0) Uptrend[x+1]=ExtMapBuffer[x+1];
      Dntrend[x] = EMPTY_VALUE;
    }
    else
    if (trend[x]<0)
    {
      Dntrend[x] = ExtMapBuffer[x];
      if (trend[x+1]>0) Dntrend[x+1]=ExtMapBuffer[x+1];
      Uptrend[x] = EMPTY_VALUE;
    }

    //Print( " trend=",trend[x]);
    }

    return(0);
}
//+------------------------------------------------------------------+
Comments