SnakeForce
Download script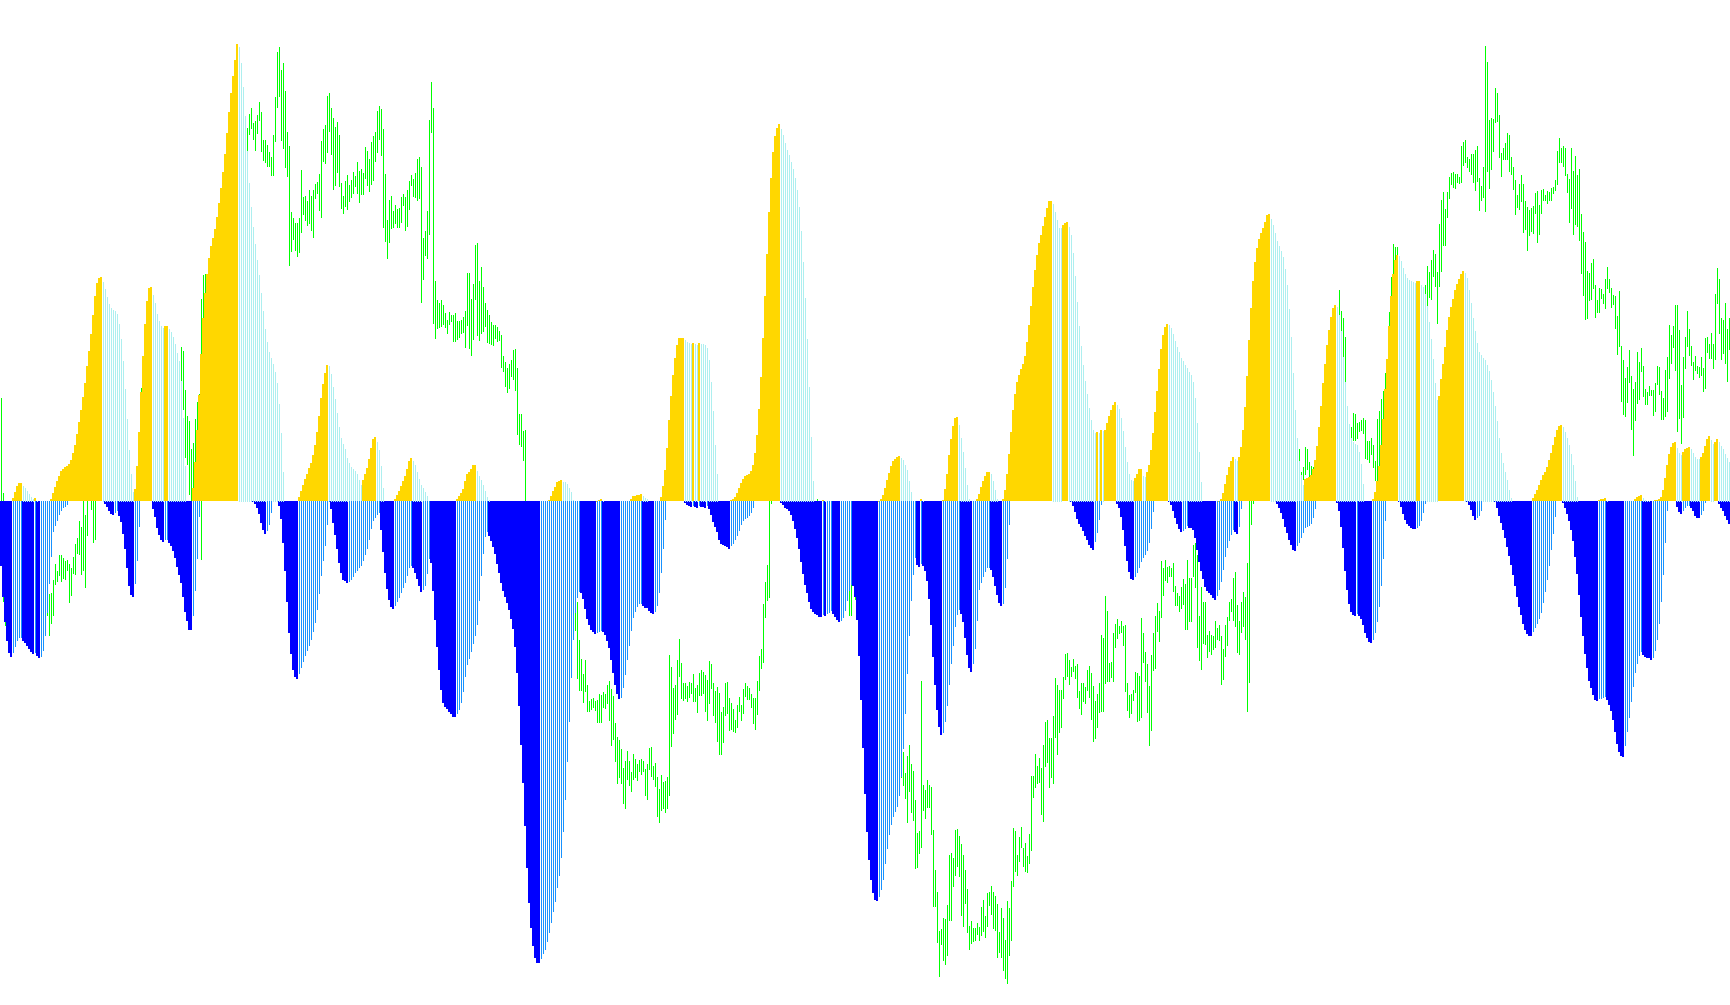
This script, titled SnakeInBorders, is a custom technical analysis tool designed to visualize market momentum and potential price boundaries. It functions by creating a dynamic "path" (the Snake) that tracks price trends while simultaneously identifying zones of strength and resistance.
Core Logic and Functionality
1. The "Snake" Price Path At the heart of the script is a proprietary calculation method used to determine a smooth trend line, referred to as the "Snake." Unlike standard moving averages that might react too quickly or too slowly to price changes, this logic uses a weighted system. It looks at a window of data points around the current price and applies specific weights to them. This creates a fluid, organic path that helps filter out market "noise" while staying closely aligned with the actual price movement.
2. Momentum and Force Detection The script doesn't just show you where the price is; it attempts to measure the intensity of the movement. It calculates the distance between the current "Snake" value and the highest or lowest points reached over a specific period (defined by the user). By measuring this gap, the tool distinguishes between:
- Force: When the price is moving aggressively toward a new territory.
- Resistance/Support: When the price movement begins to lose steam or "flatten out" as it approaches a previous extreme.
3. Visual Indicators The script translates these complex calculations into four distinct visual elements on your chart:
- Force Up / Force Down: These represent active momentum. If the price is pushing upward with strength, one indicator will highlight this energy; if it is pushing downward, the corresponding counter-indicator activates.
- Resistance Up / Resistance Down: These act as "warning" markers. They appear when the price movement suggests it is encountering friction or reaching a boundary where the current trend might exhaust itself.
User Experience
From a practical standpoint, the script automatically adjusts its naming conventions based on the timeframe you are viewing (detecting Minutes, Hours, or Days) to ensure the information remains relevant to your specific trading session.
For a trader, this means instead of just seeing a line on a chart, you are looking at a visual representation of market "health." It helps identify whether a current trend is still healthy and powerful (Force) or if it is starting to struggle against previous price levels (Resistance), providing a more nuanced view of the market's direction.
//+------------------------------------------------------------------+
//|                                               SnakeInBorders.mq4 |
//|                                      "ÈÍÄÈÊÀÒÎÐÛ ÄËß ÑÀÌÎÎÁÌÀÍÀ" |
//|                           Bookkeeper, 2006, yuzefovich@gmail.com |
//+------------------------------------------------------------------+
#property copyright ""
#property link      ""
//+------------------------------------------------------------------+
#property  indicator_separate_window
#property indicator_buffers 4
#property indicator_color1  Lime
#property indicator_color2  Red
#property indicator_color3  Lime
#property indicator_color4  Red
//----
extern int  cPeriod=24;
//----
double    ForceUp[];
double    ForceDown[];
double    ResistanceUp[];
double    ResistanceDown[];
double    Mart[];
//----
double Snake_Sum, Snake_Weight, Snake_Sum_Minus, Snake_Sum_Plus;
//----
int init()
{
int    draw_begin;
double indperiod,val1,val2;
string CommentStr;
   draw_begin=3*cPeriod;
   IndicatorBuffers(5);
   SetIndexBuffer(0,ForceUp);
   SetIndexBuffer(1,ForceDown);
   SetIndexBuffer(2,ResistanceUp);
   SetIndexBuffer(3,ResistanceDown);
   SetIndexBuffer(4,Mart);
   SetIndexStyle(0,DRAW_HISTOGRAM,EMPTY,2);
   SetIndexStyle(1,DRAW_HISTOGRAM,EMPTY,2);
   SetIndexStyle(2,DRAW_HISTOGRAM);
   SetIndexStyle(3,DRAW_HISTOGRAM);
   SetIndexStyle(4,DRAW_NONE);
   SetIndexLabel(2,NULL);
   SetIndexLabel(3,NULL);
   SetIndexLabel(4,NULL);
   SetIndexDrawBegin(0,draw_begin);
   SetIndexDrawBegin(1,draw_begin);
   SetIndexDrawBegin(2,draw_begin);
   SetIndexDrawBegin(3,draw_begin);
   SetIndexDrawBegin(4,draw_begin);
   indperiod=1.0*cPeriod*Period();
   if(indperiod<60)
   {
      CommentStr=DoubleToStr(indperiod,0);
      CommentStr=" M"+CommentStr+", FORCE UP -DOWN ";
   }
   else
   {
      indperiod=indperiod/60;
      if(indperiod>=24)
      {
         val1=MathAbs(MathRound(indperiod/24)-indperiod/24);
         if(val1<0.01)
         {
            CommentStr=DoubleToStr(indperiod/24,0);
            CommentStr=" D"+CommentStr+", FORCE UP -DOWN ";
         }
          else
         {
            CommentStr=DoubleToStr(indperiod/24,1);
            CommentStr=" D"+CommentStr+", FORCE UP -DOWN ";
         }
      }
      else
      {
         val1=MathAbs(MathRound(indperiod)-indperiod);
         if(val1<0.01)
         {
            CommentStr=DoubleToStr(indperiod,0);
            CommentStr=" H"+CommentStr+", FORCE UP -DOWN ";
         }
          else
         {
            CommentStr=DoubleToStr(indperiod,1);
            CommentStr=" H"+CommentStr+", FORCE UP -DOWN ";
         }
      }
   }
   IndicatorShortName("SnakeInBorders"+CommentStr);
   return(0);
}
//----
void deinit()
{
}
//----
int start()
{
int FirstPos, ExtCountedBars=0,i;
   if(Bars<=50) return(0);
   if(cPeriod<21) return(0);
   ExtCountedBars=IndicatorCounted();
   if (ExtCountedBars<0) return(-1);
   if (ExtCountedBars>0) ExtCountedBars--;
   FirstPos=Bars-ExtCountedBars-1;
   if(FirstPos>Bars-cPeriod-7)
   {
      FirstPos=Bars-cPeriod-7;
      Mart[FirstPos+cPeriod]=SnakeFirstCalc(FirstPos+cPeriod);
      for(i=FirstPos+cPeriod-1;i>FirstPos;i--) SnakeNextCalc(i);
   }
   Snake(FirstPos);
   return(0);
}
//----
void Snake(int Pos)
{
int i;
   if(Pos<6) Pos=6;
   Mart[Pos]=SnakeFirstCalc(Pos);
   Drawing(Pos);
   Pos--;
   while(Pos>=5)
   {
      Mart[Pos]=SnakeNextCalc(Pos);
      Drawing(Pos);
      Pos--;
   }
   while(Pos>0)
   {
      Mart[Pos]=SnakeFirstCalc(Pos);
      Drawing(Pos);
      Pos--;
   }
   if(Pos==0)
   {
//      Mart[Pos]=iMA(NULL,0,6,0,MODE_LWMA,PRICE_TYPICAL,0);
      Mart[Pos]=iMA(NULL,0,6,0,MODE_LWMA,PRICE_CLOSE,0);
      Drawing(Pos);
   }
   return;
}
//----
double SnakePrice(int Shift)
{
//   return((2*Close[Shift]+High[Shift]+Low[Shift])/4);
   return(Close[Shift]);
}
//----
double SnakeFirstCalc(int Shift)
{
int i, j, w;
   Snake_Sum=0.0;
   if(Shift<5)
   {
      Snake_Weight=0.0;
      i=0;
      w=Shift+5;
      while(w>=Shift)
      {
         i++;
         Snake_Sum=Snake_Sum+i*SnakePrice(w);
         Snake_Weight=Snake_Weight+i;
         w--;
      }
      while(w>=0)
      {
         i--;
         Snake_Sum=Snake_Sum+i*SnakePrice(w);
         Snake_Weight=Snake_Weight+i;
         w--;
      }
   }
   else
   {
      Snake_Sum_Minus=0.0;
      Snake_Sum_Plus=0.0;
      for(j=Shift-5,i=Shift+5,w=1; w<=5; j++,i--,w++)
      {
         Snake_Sum=Snake_Sum+w*(SnakePrice(i)+SnakePrice(j));
         Snake_Sum_Minus=Snake_Sum_Minus+SnakePrice(i);
         Snake_Sum_Plus=Snake_Sum_Plus+SnakePrice(j);
      }
      Snake_Sum=Snake_Sum+6*SnakePrice(Shift);
      Snake_Sum_Minus=Snake_Sum_Minus+SnakePrice(Shift);
      Snake_Weight=36;
   }
   return(Snake_Sum/Snake_Weight);
}
//----
double SnakeNextCalc(int Shift)
{
   Snake_Sum_Plus=Snake_Sum_Plus+SnakePrice(Shift-5);
   Snake_Sum=Snake_Sum-Snake_Sum_Minus+Snake_Sum_Plus;
   Snake_Sum_Minus=Snake_Sum_Minus-SnakePrice(Shift+6)+SnakePrice(Shift);
   Snake_Sum_Plus=Snake_Sum_Plus-SnakePrice(Shift);
   return(Snake_Sum/Snake_Weight);
}
//----
void Drawing(int Shift)
{
double val,Dval,val1,val2,val11,val22,val3;
   val= 5*(Mart[Shift]-Mart[ArrayMinimum(Mart,cPeriod,Shift)])/9;
   Dval=5*(Mart[Shift]-
           Mart[Shift+1]+
           Mart[ArrayMinimum(Mart,cPeriod,Shift+1)]-
           Mart[ArrayMinimum(Mart,cPeriod,Shift)]   )/9;
   if(Dval>0)
   {
      ForceUp[Shift]=val;
      ResistanceUp[Shift]=0;
   }
   else
   {
      ForceUp[Shift]=0;
      ResistanceUp[Shift]=val;
   }
   val= 5*(Mart[Shift]-Mart[ArrayMaximum(Mart,cPeriod,Shift)])/9;
   Dval=5*(Mart[Shift]-
           Mart[Shift+1]+
           Mart[ArrayMaximum(Mart,cPeriod,Shift+1)]-
           Mart[ArrayMaximum(Mart,cPeriod,Shift)]   )/9;
   if(Dval<0)
   {
      ForceDown[Shift]=val;
      ResistanceDown[Shift]=0;
   }
   else
   {
      ForceDown[Shift]=0;
      ResistanceDown[Shift]=val;
   }
   return;
}
Comments