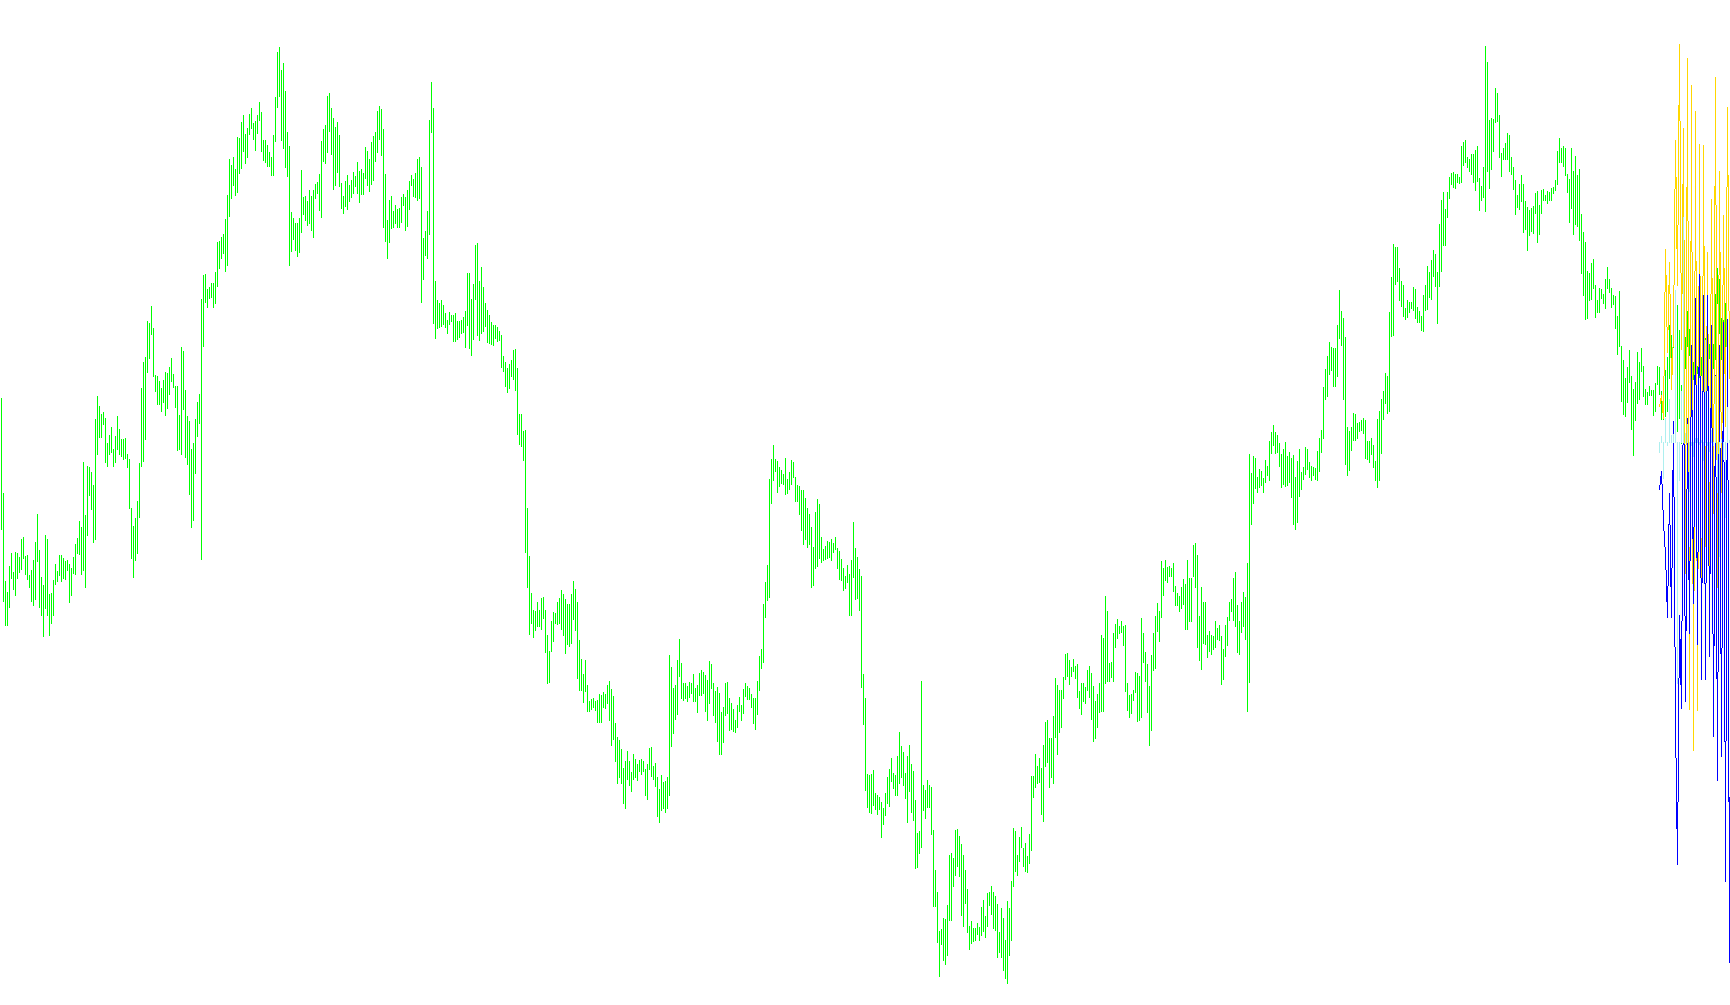
This tool is designed to provide traders with a visual representation of market sentiment by analyzing trading volume and price direction. Instead of just showing how much the price moved, it focuses on the "buying pressure" versus "selling pressure" occurring within the market.
Core Logic and Functionality
The script operates by breaking down market activity into three distinct components that are displayed in a separate window below your main price chart:
1. Tracking Price Movement The tool constantly monitors the price changes on a minute-by-minute basis. It looks at every candle to determine if the price closed higher, lower, or remained unchanged compared to the previous minute.
2. Volume Distribution (Buying vs. Selling) Once a price movement is identified, the script assigns the corresponding volume to either a "Buy" category or a "Sell" category:
- Bullish Activity: If the price closes higher than the previous period, the total volume of that period is added to the buying pressure.
- Bearish Activity: If the price closes lower, the volume is subtracted from the overall total, representing selling pressure.
- Neutral Activity: If the price remains unchanged (flat), the script splits the volume equally between both buying and selling sides.
3. Visual Indicators The logic translates these calculations into three distinct visual elements on your screen:
- Buying Pressure: Represented by a green line, showing the cumulative strength of buyers in the market.
- Selling Pressure: Represented by a red line, showing the cumulative strength of sellers.
- Market Sentiment (Volume Histogram): A yellow histogram that combines the values of both buying and selling pressure. This helps traders see the total momentum or "intensity" of the market at any given time.
How to Interpret the Results
The primary goal of this logic is to help you see who is currently "in control" of the market. By watching the interaction between the green (buying) and red (selling) lines, you can identify whether the current trend is being supported by strong volume or if the momentum is starting to shift. The yellow histogram provides a quick reference for the overall magnitude of the trading activity happening in that moment.
//+------------------------------------------------------------------+
//|                                     Waddah Attar Buy Sell Volume |
//|                               Copyright © 2007, ww.metaforex.net |
//|                                   Waddah Attar www.metaforex.net |
//+------------------------------------------------------------------+
#property copyright "Copyright © 2007, www.metaforex.net"
#property link      "www.metaforex.net"
//----
#property indicator_separate_window
#property indicator_buffers 3
#property indicator_color1 Green
#property indicator_color2 Red
#property indicator_color3 Yellow
#property indicator_level1 0
//---- buffers
double P1;
double P2;
double P1Buffer[];
double P2Buffer[];
double P3Buffer[];
//----
//+------------------------------------------------------------------+
//| Custom indicator initialization function                         |
//+------------------------------------------------------------------+
int init()
  {
   SetIndexBuffer(0, P1Buffer);
   SetIndexEmptyValue(0,0);
   SetIndexBuffer(1, P2Buffer);
   SetIndexEmptyValue(1,0);
   SetIndexBuffer(2, P3Buffer);
   SetIndexEmptyValue(2,0);
//----
   SetIndexStyle(0, DRAW_LINE, STYLE_SOLID, 1);
   SetIndexStyle(1, DRAW_LINE, STYLE_SOLID, 1);
   SetIndexStyle(2, DRAW_HISTOGRAM, STYLE_SOLID, 1);
//----
   IndicatorDigits(0);
   //Comment("Waddah Attar Buy Sell Volume www.metaforex.net");
   return(0);
  }
//+------------------------------------------------------------------+
//| Custor indicator deinitialization function                       |
//+------------------------------------------------------------------+
int deinit()
  {
   Comment("");
   return(0);
  }
//+------------------------------------------------------------------+
//| Custom indicator iteration function                              |
//+------------------------------------------------------------------+
int start()
  {

   int i,ii;
   static int pii=-1;

   //for(i = 0; i <iBars(Symbol(),PERIOD_M1) ; i++)
   i=iBars(Symbol(),PERIOD_M1);
   while(i>=0)
     {
       ii = iBarShift(Symbol(), Period(), iTime(Symbol(),PERIOD_M1,i), true);
       //----
       if (pii!=ii)
       {
         P1=0;
         P2=0;
         P1Buffer[ii]=0;
         P2Buffer[ii]=0;
         P3Buffer[ii]=0;
       }

       if (ii != -1)
       {
         if (iClose(Symbol(),PERIOD_M1,i)>iClose(Symbol(),PERIOD_M1,i+1))
         {
           P1 = P1+(iVolume(Symbol(),PERIOD_M1,i));
         }
         if (iClose(Symbol(),PERIOD_M1,i)<iClose(Symbol(),PERIOD_M1,i+1))
         {
           P2 = P2-(iVolume(Symbol(),PERIOD_M1,i));
         }
         if (iClose(Symbol(),PERIOD_M1,i)==iClose(Symbol(),PERIOD_M1,i+1))
         {
           P1 = P1+(iVolume(Symbol(),PERIOD_M1,i)/2);
           P2 = P2-(iVolume(Symbol(),PERIOD_M1,i)/2);
         }
       }
       P1Buffer[ii]=P1;
       P2Buffer[ii]=P2;
       P3Buffer[ii]=P1+P2;

       pii=ii;

       P1Buffer[i]-=P1Buffer[i+1];
       P2Buffer[i]-=P2Buffer[i+1];
       //P3Buffer[i]-=P3Buffer[i+1];
       i--;
    }
//----
   return(0);
  }
Comments