SSRC_Alert
Download script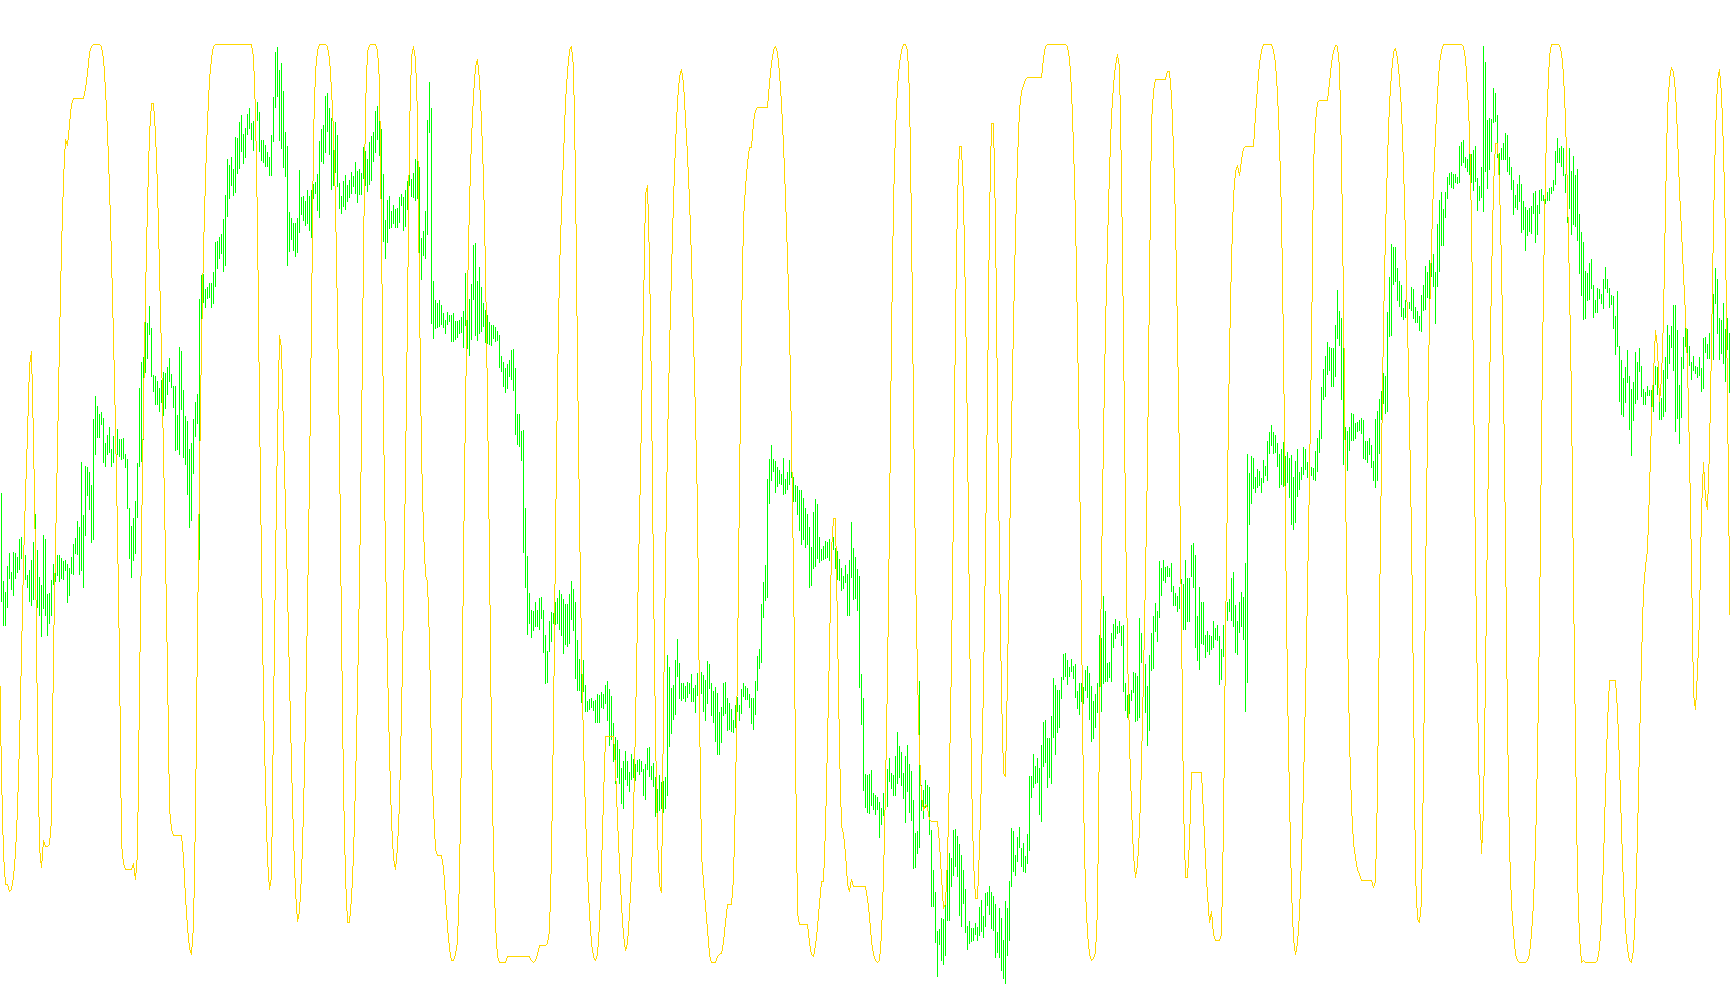
This technical tool is designed to analyze price movements by measuring the strength and consistency of market trends. Instead of looking at simple price changes, it utilizes a sophisticated statistical method to determine how closely related current price actions are to historical patterns over a specific window of time.
Core Logic and Processing Steps
The script operates through four primary stages to filter out market noise and generate a clear signal:
1. Price Selection and "Snake" Smoothing The tool begins by choosing a specific type of price data (such as the Close, High, Low, or a weighted average). It then applies a custom smoothing technique known as the "Snake." This isn't a standard moving average; it applies varying weights to nearby price points to create a more fluid and responsive baseline. This helps the tool identify the "true" underlying direction of the asset while minimizing the impact of erratic, minor fluctuations.
2. Martingale-Style Filtering Once the smoothed baseline is established, the script performs a secondary smoothing process. It identifies the highest and lowest points within a set period and uses them to calculate a refined value. This step acts as a stabilizer, ensuring that the indicator doesn't react too aggressively to sudden spikes or "fake-outs" in the market.
3. Spearman Rank Correlation (The Analytical Engine) This is the core mathematical heart of the script. Rather than calculating standard correlation (which can be misled by outliers), it uses Spearman’s Rank Correlation.
- It converts price data into "ranks" (ordering them from highest to lowest).
- It then calculates how consistently these ranks progress over a set timeframe.
- The result is a value between -1.0 and 1.0, where:
- Close to 1.0: Indicates a very strong, consistent upward trend.
- Close to -1.0: Indicates a very strong, consistent downward trend.
- Near 0: Indicates a chaotic market with no clear direction or a sideways "flat" movement.
4. Signal Generation and Alerts The final output is displayed in a separate window as a dynamic line. The script monitors this line for specific "breakout" moments:
- Sell Signal: Triggered when the indicator value crosses above the 0.9 threshold (indicating extreme upward momentum is reaching a peak and may be ready to reverse).
- Buy Signal: Triggered when the indicator value crosses below the -0.9 threshold (indicating extreme downward momentum is bottoming out).
The tool is designed to ignore multiple signals within the same candle, ensuring that users only receive one alert per bar once a specific trend threshold has been crossed.
//+------------+-----------------------------------------------------+
//| v.12.04.07 |                                            SSRC.mq4 |
//+------------+              Spearman,                              |
//|            |              Rosh                                   |
//|            |              È ïðèìàçàâøèéñÿ ê íèì                  |
//|            |              Bookkeeper, 2007, yuzefovich@gmail.com |
//+------------+-----------------------------------------------------+
// http://www.improvedoutcomes.com/docs/WebSiteDocs/Clustering/
// Clustering_Parameters/Spearman_Rank_Correlation_Distance_Metric.htm
// http://www.infamed.com/stat/s05.html
// http://www.metaquotes.net
// http://codebase.mql4.com/ru/1023
#property copyright ""
#property link      "http://www.forexter.land.ru/indicators.htm"
//----
#property indicator_separate_window
#property indicator_maximum  1.3
#property indicator_minimum -1.3
#property indicator_level1   0.9
#property indicator_level2  -0.9
#property indicator_level3   0.8
#property indicator_level4  -0.8
#property indicator_level5   0.7
#property indicator_level6  -0.7
#property indicator_levelcolor DimGray
#property indicator_buffers  1
#property indicator_color1   Maroon
//---- input parameters
//---- Snake
extern int    SnakeRange   =3;
extern int    FilterPeriod =21;
extern double MartFiltr    =2;
extern int    PriceConst   =0; // 0 - Close
                               // 1 - Open
                               // 2 - High
                               // 3 - Low
                               // 4 - (H+L)/2
                               // 5 - (H+L+C)/3
                               // 6 - (H+L+2*C)/4
//---- buffers
double SRCBuffer[];
double Axis[];
double Mart[];
#define SIGNAL_BAR 1

//---- SpearmanRankCorrelation
int    rangeN = 14; //   = 30 maximum
double R2[];
double multiply;
int    PriceInt[];
int    SortInt[];
//+------------------------------------------------------------------+
void MartAxis(int Pos) { int SnakeWeight,i,w,ww,Shift;double SnakeSum;
switch(PriceConst) {
case  0:
  Axis[Pos]=iMA(NULL,0,SnakeRange+1,0,MODE_LWMA,PRICE_CLOSE,Pos);
  break;
case  1:
  Axis[Pos]=iMA(NULL,0,SnakeRange+1,0,MODE_LWMA,PRICE_OPEN,Pos);
  break;
case  2:
  Axis[Pos]=iMA(NULL,0,SnakeRange+1,0,MODE_LWMA,PRICE_HIGH,Pos);
  break;
case  3:
  Axis[Pos]=iMA(NULL,0,SnakeRange+1,0,MODE_LWMA,PRICE_LOW,Pos);
  break;
case  4:
  Axis[Pos]=iMA(NULL,0,SnakeRange+1,0,MODE_LWMA,PRICE_MEDIAN,Pos);
  break;
case  5:
  Axis[Pos]=iMA(NULL,0,SnakeRange+1,0,MODE_LWMA,PRICE_TYPICAL,Pos);
  break;
case  6:
  Axis[Pos]=iMA(NULL,0,SnakeRange+1,0,MODE_LWMA,PRICE_WEIGHTED,Pos);
  break;
default:
  Axis[Pos]=iMA(NULL,0,SnakeRange+1,0,MODE_LWMA,PRICE_WEIGHTED,Pos);
  break; }
for(Shift=Pos+SnakeRange+2;Shift>Pos;Shift--) { SnakeSum=0.0;
SnakeWeight=0; i=0; w=Shift+SnakeRange; ww=Shift-SnakeRange;
if(ww<Pos) ww=Pos;
while(w>=Shift) { i++; SnakeSum=SnakeSum+i*SnakePrice(w);
SnakeWeight=SnakeWeight+i; w--; }
while(w>=ww) { i--; SnakeSum=SnakeSum+i*SnakePrice(w);
SnakeWeight=SnakeWeight+i; w--; }
Axis[Shift]=SnakeSum/SnakeWeight; } return; }
//----
double SnakePrice(int Shift) {
switch(PriceConst) {
   case  0: return(Close[Shift]);
   case  1: return(Open[Shift]);
   case  2: return(High[Shift]);
   case  3: return(Low[Shift]);
   case  4: return((High[Shift]+Low[Shift])/2);
   case  5: return((Close[Shift]+High[Shift]+Low[Shift])/3);
   case  6: return((2*Close[Shift]+High[Shift]+Low[Shift])/4);
   default: return(Close[Shift]); } }
//+------------------------------------------------------------------+
void SmoothOverMart(int Shift) { double t,b;
t=Axis[ArrayMaximum(Axis,FilterPeriod,Shift)];
b=Axis[ArrayMinimum(Axis,FilterPeriod,Shift)];
Mart[Shift]=(2*(2+MartFiltr)*Axis[Shift]-(t+b))/2/(1+MartFiltr);
return; }
//+------------------------------------------------------------------+
double SpearmanRankCorrelation(double Ranks[], int N) { double res,z2;
for(int i=0;i<N;i++) { z2 += MathPow(Ranks[i] - i - 1, 2); }
res=1-6*z2/(MathPow(N,3)-N); return(res); }
//+------------------------------------------------------------------+
void RankPrices(int InitialArray[]) { double dcounter, averageRank;
int i, k, m, dublicat, counter, etalon; double TrueRanks[];
ArrayResize(TrueRanks, rangeN); ArrayCopy(SortInt, InitialArray);
for(i=0;i<rangeN;i++) TrueRanks[i]=i+1;
ArraySort(SortInt, 0, 0, MODE_DESCEND);
for(i=0;i<rangeN-1;i++) { if(SortInt[i]!=SortInt[i+1]) continue;
dublicat=SortInt[i]; k=i+1; counter=1; averageRank=i+1;
while(k<rangeN) { if(SortInt[k]==dublicat) {
counter++; averageRank+=k+1; k++; } else break; }
dcounter=counter; averageRank=averageRank/dcounter;
for(m=i;m<k;m++) TrueRanks[m]=averageRank; i=k; }
for(i=0;i<rangeN;i++) { etalon=InitialArray[i]; k=0;
while(k<rangeN) { if(etalon==SortInt[k]) {
R2[i]=TrueRanks[k]; break; } k++; } } return; }
//+------------------------------------------------------------------+
int init() { IndicatorBuffers(3);
SetIndexBuffer(0,SRCBuffer); SetIndexStyle(0,DRAW_LINE);
SetIndexBuffer(1,Axis); SetIndexStyle(1,DRAW_NONE);
SetIndexBuffer(2,Mart); SetIndexStyle(2,DRAW_NONE);
ArrayResize(R2,rangeN); ArrayResize(PriceInt,rangeN);
ArrayResize(SortInt,rangeN);
if(rangeN>30) IndicatorShortName("Decrease rangeN input!");
else
IndicatorShortName("SSRC( SR:"+SnakeRange+", FP:"+FilterPeriod+" )");
multiply=MathPow(10,Digits); return(0); }
//+------------------------------------------------------------------+
int deinit() { return(0); }
//+------------------------------------------------------------------+
int start() { int i,k,limit,limit2,limit3;
int counted_bars=IndicatorCounted(); if(rangeN>30) return(-1);
if(counted_bars==0) {
limit=Bars-(rangeN+FilterPeriod+SnakeRange+4);
limit2=Bars-(SnakeRange+2);
limit3=Bars-(FilterPeriod+SnakeRange+3); }
if(counted_bars>0) {
limit=Bars-counted_bars+1; limit2=limit; limit3=limit; }
for(i=limit2;i>=0;i--) MartAxis(i);
for(i=limit3;i>=0;i--) SmoothOverMart(i);
for(i=limit;i>=0;i--) {
for(k=0;k<rangeN;k++) PriceInt[k]=Mart[i+k]*multiply;
RankPrices(PriceInt); SRCBuffer[i]=SpearmanRankCorrelation(R2,rangeN);
if(SRCBuffer[i]>1.0) SRCBuffer[i]=1.0;
if(SRCBuffer[i]<-1.0) SRCBuffer[i]=-1.0; }

    //---- Ñòàòè÷åñêèå ïåðåìåííûå, â êîòîðûõ õðàíÿòñÿ
    //---- âðåìÿ ïîñëåäíåãî áàðà è íàïðàâëåíèå ïîñëåäíåãî ñèãíàëà
    static int PrevSignal = 0, PrevTime = 0;

    //---- Åñëè áàðîì äëÿ àíàëèçà âûáðàí íå 0-é, íàì íåò ñìûñëà ïðîâåðÿòü ñèãíàë
    //---- íåñêîëüêî ðàç. Åñëè íå íà÷àëñÿ íîâûé áàð, âûõîäèì.
    if(SIGNAL_BAR > 0 && Time[0] <= PrevTime )
        return(0);
    //---- Îòìå÷àåì, ÷òî ýòîò áàð ïðîâåðåí
    PrevTime = Time[0];

    if(PrevSignal <= 0)
      {
        if(SRCBuffer[SIGNAL_BAR] - 0.9 >= 0 &&
           0.9 - SRCBuffer[SIGNAL_BAR+1] >= 0)
          {
            PrevSignal = 1;
            Alert("SSRC lvl 0.9 (", Symbol(), ", ", Period(), ")  -  SELL!!!");
          }
      }
    if(PrevSignal >= 0)
      {
        if(SRCBuffer[SIGNAL_BAR+1] + 0.9 >= 0 &&
           SRCBuffer[SIGNAL_BAR] + 0.9 <= 0)
          {
            PrevSignal = -1;
            Alert("SSRC lvl 0.9 (", Symbol(), ", ", Period(), ")  -  BUY!!!");
          }
      }

return(0); }
//+------------------------------------------------------------------+
Comments