StepMA_3D_revised_002
Download script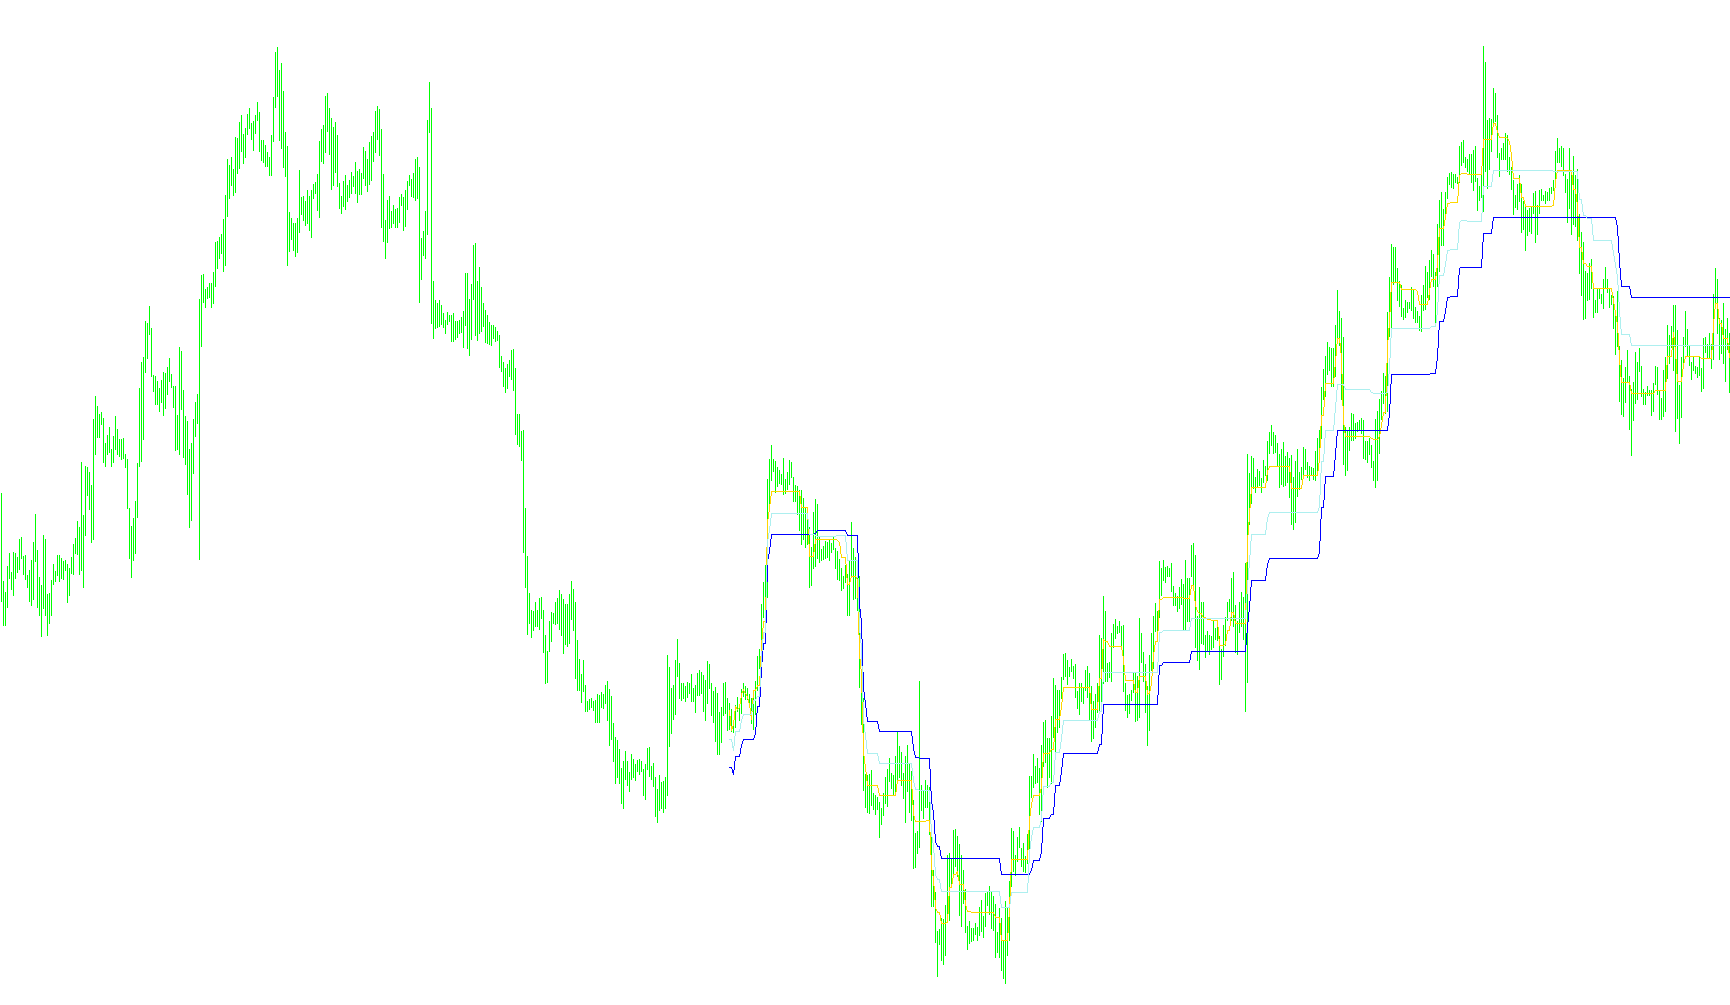
Technical Overview: StepMA 3D Logic
The StepMA 3D is a specialized technical analysis tool designed to visualize market trends by creating "stepped" moving averages. Unlike standard moving averages that flow in smooth curves, this indicator moves in discrete horizontal levels. This approach helps traders identify clear trend boundaries and potential price exhaustion points by filtering out minor market "noise."
How the Logic Works
1. Volatility Measurement (ATR Integration) The script begins by analyzing a specific period of historical data to calculate the market's current volatility. It looks at the range between the highs and lows of recent candles, applying a weighted calculation where more recent price action carries more significance. This results in a dynamic "Step Size"—essentially determining how large or small the horizontal steps should be based on how much the market is currently moving.
2. Three-Tiered Trend Analysis The indicator calculates three distinct trend lines simultaneously, each representing a different level of sensitivity:
- Minimum (Conservative): Based on the smallest calculated volatility range.
- Maximum (Aggressive): Based on the largest calculated volatility range.
- Mid (Balanced): Based on an average of the minimum and maximum ranges.
3. Trend Direction and "Stickiness" The script determines the direction of the trend by comparing the current closing price against the previous step's boundaries:
- If the price breaks above a certain threshold, the trend is considered upward, and the line moves to the next higher "step."
- If the price breaks below that same threshold, the trend is considered downward, and the line moves to the next lower "step."
A key feature of this logic is its momentum preservation. The indicator is designed so that a single minor price fluctuation won't cause the line to jump erratically. It requires the price to move significantly enough to cross the established boundaries before the step "locks" into a new position.
4. Visual Interpretation On a trading chart, this logic produces three distinct lines:
- The Yellow Line (Min): Provides a tight, sensitive look at the trend.
- The DeepSkyBlue Line (Mid): Offers a balanced view of the market's core movement.
- The Tomato Line (Max): Provides a broad, lagging perspective that only reacts to major structural shifts in price.
By observing how these three lines interact, users can identify periods of strong trending markets (where the lines move in unison) versus ranging markets (where the lines may flatten out or diverge), providing a multi-layered view of market sentiment.
//+------------------------------------------------------------------+
//|                                                    StepMA_v2.mq4 |
//|                           Copyright © 2005, TrendLaboratory Ltd. |
//|                                       E-mail: igorad2004@list.ru |
//+------------------------------------------------------------------+
#property copyright "Copyright © 2005, TrendLaboratory Ltd."
#property link      "E-mail: igorad2004@list.ru"

#property indicator_chart_window
#property indicator_buffers 3
#property indicator_color1 Yellow
#property indicator_color2 DeepSkyBlue
#property indicator_color3 Tomato
//---- input parameters
extern int PeriodWATR=10;
extern double Kwatr=1.0000;
extern int AdvanceMin=0;
extern int AdvanceMax=0;
extern int AdvanceMid=0;
extern int HighLow=0;
extern int maxbars=500;
//---- indicator buffers
double LineMinBuffer[];
double LineMaxBuffer[];
double LineMidBuffer[];
//+------------------------------------------------------------------+
//| Custom indicator initialization function                         |
//+------------------------------------------------------------------+
  int init()
  {
   string short_name;
//---- indicator line
   SetIndexStyle(0,DRAW_LINE,STYLE_SOLID,1);
   SetIndexStyle(1,DRAW_LINE,STYLE_SOLID,1);
   SetIndexStyle(2,DRAW_LINE,STYLE_SOLID,1);
   SetIndexShift(0,AdvanceMin);
   SetIndexShift(1,AdvanceMax);
   SetIndexShift(2,AdvanceMid);
   SetIndexBuffer(0,LineMinBuffer);
   SetIndexBuffer(1,LineMaxBuffer);
   SetIndexBuffer(2,LineMidBuffer);
   IndicatorDigits(MarketInfo(Symbol(),MODE_DIGITS));
//---- name for DataWindow and indicator subwindow label
   short_name="StepMA 3D("+PeriodWATR+")";
   IndicatorShortName(short_name);
   SetIndexLabel(0,"StepMA min");
   SetIndexLabel(1,"StepMA max");
   SetIndexLabel(2,"StepMA mid");
//----
   SetIndexDrawBegin(0,PeriodWATR);
   SetIndexDrawBegin(1,PeriodWATR);
   SetIndexDrawBegin(2,PeriodWATR);
//----
   return(0);
  }

//+------------------------------------------------------------------+
//| StepMA_3D_v1                                                         |
//+------------------------------------------------------------------+
int start()
  {
   int      i,shift,TrendMin,TrendMax,TrendMid;
   double   SminMin0,SmaxMin0,SminMin1,SmaxMin1,SumRange,dK,WATR0,WATRmax,WATRmin,WATRmid;
   double   SminMax0,SmaxMax0,SminMax1,SmaxMax1,SminMid0,SmaxMid0,SminMid1,SmaxMid1;


   for(shift=maxbars-1;shift>=0;shift--)
   {
	SumRange=0;
	for (i=PeriodWATR-1;i>=0;i--)
	    {
       dK = 1.0+1.0*(PeriodWATR-i)/PeriodWATR;
       SumRange+= dK*MathAbs(High[i+shift]-Low[i+shift]);
       //Print(" dK= ",dK);
       }
	WATR0 = SumRange/PeriodWATR;

	WATRmax=MathMax(WATR0,WATRmax);
	if (shift==maxbars-1-PeriodWATR) WATRmin=WATR0;
	WATRmin=MathMin(WATR0,WATRmin);

	int StepSizeMin=MathRound(Kwatr*WATRmin/Point);
	int StepSizeMax=MathRound(Kwatr*WATRmax/Point);
	int StepSizeMid=MathRound(Kwatr*0.5*(WATRmax+WATRmin)/Point);

	Comment(" StepSize_min = ", StepSizeMin,"\n",
	        " StepSize_mid = ", StepSizeMid,"\n",
	        " StepSize_max = ", StepSizeMax);

	if (HighLow>0)
	  {
	  SmaxMin0=Low[shift]+2*StepSizeMin*Point;
	  SminMin0=High[shift]-2*StepSizeMin*Point;

	  SmaxMax0=Low[shift]+2*StepSizeMax*Point;
	  SminMax0=High[shift]-2*StepSizeMax*Point;

	  SmaxMid0=Low[shift]+2*StepSizeMid*Point;
	  SminMid0=High[shift]-2*StepSizeMid*Point;

	  if(Close[shift]>SmaxMin1) TrendMin=1;
	  if(Close[shift]<SminMin1) TrendMin=-1;

	  if(Close[shift]>SmaxMax1) TrendMax=1;
	  if(Close[shift]<SminMax1) TrendMax=-1;

	  if(Close[shift]>SmaxMid1) TrendMid=1;
	  if(Close[shift]<SminMid1) TrendMid=-1;
	  }

	if (HighLow == 0)
	  {
	  SmaxMin0=Close[shift]+2*StepSizeMin*Point;
	  SminMin0=Close[shift]-2*StepSizeMin*Point;

	  SmaxMax0=Close[shift]+2*StepSizeMax*Point;
	  SminMax0=Close[shift]-2*StepSizeMax*Point;

	  SmaxMid0=Close[shift]+2*StepSizeMid*Point;
	  SminMid0=Close[shift]-2*StepSizeMid*Point;

	  if(Close[shift]>SmaxMin1) TrendMin=1;
	  if(Close[shift]<SminMin1) TrendMin=-1;

	  if(Close[shift]>SmaxMax1) TrendMax=1;
	  if(Close[shift]<SminMax1) TrendMax=-1;

	  if(Close[shift]>SmaxMid1) TrendMid=1;
	  if(Close[shift]<SminMid1) TrendMid=-1;
	  }

	  if(TrendMin>0 && SminMin0<SminMin1) SminMin0=SminMin1;
	  if(TrendMin<0 && SmaxMin0>SmaxMin1) SmaxMin0=SmaxMin1;

	  if(TrendMax>0 && SminMax0<SminMax1) SminMax0=SminMax1;
	  if(TrendMax<0 && SmaxMax0>SmaxMax1) SmaxMax0=SmaxMax1;

	  if(TrendMid>0 && SminMid0<SminMid1) SminMid0=SminMid1;
	  if(TrendMid<0 && SmaxMid0>SmaxMid1) SmaxMid0=SmaxMid1;


	  if (TrendMin>0) LineMinBuffer[shift]=SminMin0+StepSizeMin*Point;
	  if (TrendMin<0) LineMinBuffer[shift]=SmaxMin0-StepSizeMin*Point;

	  if (TrendMax>0) LineMaxBuffer[shift]=SminMax0+StepSizeMax*Point;
	  if (TrendMax<0) LineMaxBuffer[shift]=SmaxMax0-StepSizeMax*Point;

	  if (TrendMid>0) LineMidBuffer[shift]=SminMid0+StepSizeMid*Point;
	  if (TrendMid<0) LineMidBuffer[shift]=SmaxMid0-StepSizeMid*Point;

	  SminMin1=SminMin0;
	  SmaxMin1=SmaxMin0;

	  SminMax1=SminMax0;
	  SmaxMax1=SmaxMax0;

	  SminMid1=SminMid0;
	  SmaxMid1=SmaxMid0;
	 }
	return(0);
 }
Comments