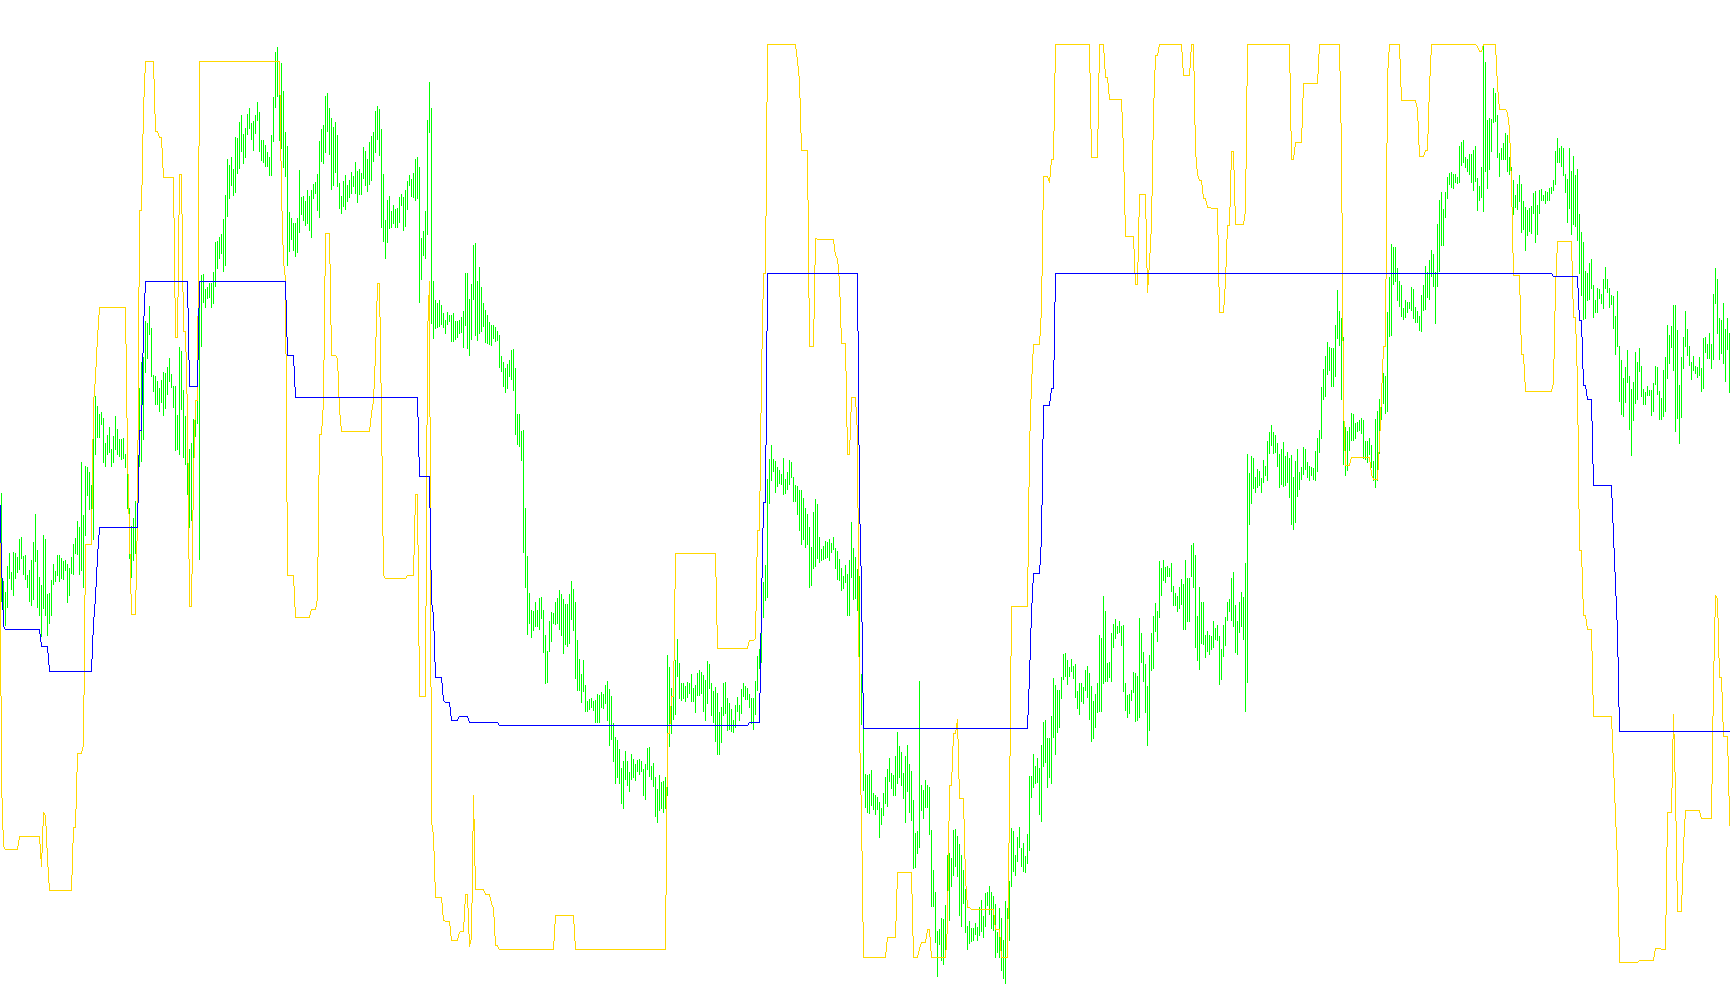
This script is a custom technical analysis tool designed for the MetaTrader platform. It functions by analyzing market price movement to determine trends and volatility, ultimately translating that data into two distinct visual lines.
Core Logic Overview
The indicator works by measuring the "range" of price movements over a specific period. It looks at the difference between high and low prices to understand how much the market is fluctuating. This information is used to create dynamic boundaries for what it considers a "trend."
How the Calculations Work
-
Volatility Tracking: The script calculates a weighted average of price ranges. By doing this, it identifies the minimum and maximum volatility recently observed by the market. This ensures that the indicator adapts to whether the market is moving very slowly or very quickly.
-
Dynamic Step Sizing: Using the volatility data, the script establishes three different "step sizes" (Small, Medium, and Large). These steps act as thresholds. They determine how much price movement is required to confirm a change in the market's direction.
-
Trend Detection: The tool constantly compares the current price against these dynamic thresholds. It attempts to categorize the trend into three levels:
- Minimum Trend: The most sensitive level of price movement.
- Maximum Trend: The strongest, most significant level of price movement.
- Mid Trend: A balanced middle ground between the two.
-
Momentum Normalization (Stochastic Conversion): Instead of showing you raw price points or standard trend lines, the script converts these findings into a "Stochastic" format. It takes the current trend position and maps it onto a scale (typically between 0 and 1).
Visual Output
The result is two lines displayed in a separate window:
- Line 1: Represents the normalized value of the "Minimum" trend.
- Line 2: Represents the normalized value of the "Mid" trend.
By observing these two lines, a user can see how the current price momentum compares to historical volatility. When the lines move in relation to each other or reach certain levels, it provides a visual representation of where the price sits within the current market structure.
//+X----------------------------------------------------------------x+
// Edited Nikolay Kositsin  2008.05.20 E-mail: farria@mail.redcom.ru |
//+X----------------------------------------------------------------x+
//+X================================================================X+
//|                                              StepMA_Stoch_NK.mq4 |
//|                          Copyright © 2005,  TrendLaboratory Ltd. |
//|                                       E-mail: igorad2004@list.ru |
//+X================================================================X+
#property copyright "Copyright © 2005,  TrendLaboratory Ltd."
#property link "http://www.forex-instruments.info"
//---- îòðèñîâêà èíäèêàòîðà â îòäåëüíîì îêíå
#property indicator_separate_window
//---- êîëè÷åñòâî èíäèêàòîðíûõ áóôåðîâ
#property indicator_buffers 2
//---- öâåòà èíäèêàòîðà
#property indicator_color1 Gold
#property indicator_color2 BlueViolet
#property indicator_style1 STYLE_DASHDOTDOT
#property indicator_width2 2
//---- îïðåäåëåíèå íèæíåãî è âåðõíåãî
            //çíà÷åíèÿ îòäåëüíîãî îêíà èíäèêàòîðà
#property indicator_minimum 0
#property indicator_maximum 1
//---- ÂÕÎÄÍÛÅ ÏÀÐÀÌÅÒÐÛ ÈÍÄÈÊÀÒÎÐÀ
extern int    PeriodWATR = 10;
extern double Kwatr = 1.0000;
extern int    HighLow = 0;
//---- èíäèêàòîðíûå áóôåðû
double LineMinBuffer[];
double LineMidBuffer[];
//+X================================================================X+
//| StepMA_Stoch_NK indicator initialization function                |
//+X================================================================X+
  int init()
  {
//---- óñòàíîâêà ñòèëÿ èçîáðàæåíèÿ èíäèêàòîðà
   SetIndexStyle(0, DRAW_LINE);
   SetIndexStyle(1, DRAW_LINE);
//---- îïðåäåëåíèå áóôåðîâ äëÿ ïîäñ÷¸òà
   SetIndexBuffer(0, LineMinBuffer);
   SetIndexBuffer(1, LineMidBuffer);
//---- Óñòàíîâêà ôîðìàòà òî÷íîñòè (êîëè÷åñòâî çíàêîâ ïîñëå
          //äåñÿòè÷íîé òî÷êè) äëÿ âèçóàëèçàöèè çíà÷åíèé èíäèêàòîðà
   IndicatorDigits(Digits);
//---- name for DataWindow and indicator subwindow label
   string short_name="StepMA Stoch("
                  + PeriodWATR + ", " + Kwatr + ", " + HighLow + ")";
   IndicatorShortName(short_name);
   SetIndexLabel(0, "StepMA Stoch 1");
   SetIndexLabel(1, "StepMA Stoch 2");
//---- óñòàíîâêà íîìåðà áàðà,
                //íà÷èíàÿ ñ êîòîðîãî áóäåò îòðèñîâûâàòüñÿ èíäèêàòîð
   SetIndexDrawBegin(0, PeriodWATR);
   SetIndexDrawBegin(1, PeriodWATR);
//---- çàâåðøåíèå èíèöèàëèçàöèè
   return(0);
  }
//+X================================================================X+
//| StepMA_Stoch_NK                                                  |
//+X================================================================X+
int start()
  {
   //---- Ïðîâåðêà êîëè÷åñòâà áàðîâ íà äîñòàòî÷íîñòü
                                //äëÿ äàëüíåéøåãî ðàñ÷¸òà
   if (Bars - 1 < PeriodWATR)
                        return(0);
   //----
   static int      TrendMid_, time2;
   static int      TrendMin_, TrendMax_;
   //----
   static double   WATRmax_, WATRmin_;
   static double   SminMin1_, SmaxMin1_;
   static double   SminMax1_, SmaxMax1_;
   static double   SminMid1_, SmaxMid1_;
   //----
   int      counted_bars, Tnew;
   int      iii, bar, MaxBar, limit;
   int      TrendMin, TrendMax, TrendMid;
   int      StepSizeMin, StepSizeMax, StepSizeMid;
   //----
   double   close, high, low;
   double   WATRmax, WATRmin;
   double   SumRange, dK, WATR0;
   double   SizeMin, SizeMax, SizeMid, pKwatr;
   double   SizeMin2, SizeMax2, SizeMid2, point;
   double   SminMin0, SmaxMin0, SminMin1, SmaxMin1;
   double   SminMax0, SmaxMax0, SminMax1, SmaxMax1;
   double   SminMid0, SmaxMid0, SminMid1, SmaxMid1;
   double   Stoch1, Stoch2, bsmin, bsmax;
   double   linemin, linemax, linemid;
   //----Ïîëó÷åíèå óæå ïîñ÷èòàííûõ áàðîâ
   counted_bars = IndicatorCounted();
   //---- ïðîâåðêà íà âîçìîæíûå îøèáêè
   if (counted_bars < 0)
                 return(-1);
   //---- ïîñëåäíèé ïîñ÷èòàííûé áàð äîëæåí áûòü ïåðåñ÷èòàí
   if (counted_bars > 0)
                counted_bars--;
   //---- îïðåäåëåíèå íîìåðà ñàìîãî ñòàðîãî áàðà,
          // íà÷èíàÿ ñ êîòîðîãî áóäåò ïðîèçåä¸í ïåðåñ÷¸ò íîâûõ áàðîâ
   limit = Bars - counted_bars - 1;
   //---- îïðåäåëåíèå íîìåðà ñàìîãî ñòàðîãî áàðà,
          // íà÷èíàÿ ñ êîòîðîãî áóäåò ïðîèçåä¸í ïåðåñ÷¸ò âñåõ áàðîâ
   MaxBar = Bars - 1 - PeriodWATR;
   //----
   if (limit > MaxBar)
                limit = MaxBar;

   //+---+ âîññòàíîâëåíèå çíà÷åíèé ïåðåìåííûõ +------------------------+
   Tnew = Time[limit + 1];
   if (limit < MaxBar)
    if (Tnew == time2)
     {
      WATRmax = WATRmax_;
	   WATRmin = WATRmin_;
	   //----
      SminMin1 = SminMin1_;
	   SmaxMin1 = SmaxMin1_;
	   //----
	   SminMax1 = SminMax1_;
	   SmaxMax1 = SmaxMax1_;
	   //----
	   SminMid1 = SminMid1_;
	   SmaxMid1 = SmaxMid1_;
	   //----
	   TrendMin = TrendMin_;
	   TrendMax = TrendMax_;
	   TrendMid = TrendMid_;
     }
   else
     {
      if (Tnew>time2)
           Print("Îøèáêà âîññòàíîâëåíèÿ ïåðåìåííûõ!!! Tnew>time2");
      else Print("Îøèáêà âîññòàíîâëåíèÿ ïåðåìåííûõ!!! Tnew<time2");
      Print("Áóäåò ïðîèçâåä¸í ïåðåñ÷¸ò èíäèêàòîðà íà âñåõ áàðàõ!");
      return(-1);
     }
   //+---+ +-------------------------------------------------------------+

   for(bar = limit; bar >= 0; bar--)
   {
    //+---+ Ñîõðàíåíèå çíà÷åíèé ïåðåìåííûõ
     if (bar == 1)
       {
         WATRmax_ = WATRmax;
	      WATRmin_ = WATRmin;
	      //----
         SminMin1_ = SminMin1;
	      SmaxMin1_ = SmaxMin1;
	      //----
	      SminMax1_ = SminMax1;
	      SmaxMax1_ = SmaxMax1;
	      //----
	      SminMid1_ = SminMid1;
	      SmaxMid1_ = SmaxMid1;
	      //----
	      TrendMin_ = TrendMin;
	      TrendMax_ = TrendMax;
	      TrendMid_ = TrendMid;
	      //----
         time2 = Time[2];
       }
     //+---+
     //----
     SumRange = 0.0;
     //----
	  for (iii = PeriodWATR - 1; iii >= 0; iii--)
	    {
         dK = 1.0 + 1.0 * (PeriodWATR - iii) / PeriodWATR;
         SumRange += dK * MathAbs(High[bar + iii] - Low[bar + iii]);
       }
     //----
	  WATR0 = SumRange / PeriodWATR;
	  //----
	  WATRmax = MathMax(WATR0, WATRmax);
	  if (bar == MaxBar)
	             WATRmin = WATR0;
	  //----
	  WATRmin = MathMin(WATR0, WATRmin);
	  //----
	  point = Point;
	  //----
	  pKwatr = Kwatr / point;

	  StepSizeMin = MathRound(pKwatr * WATRmin);
	  StepSizeMax = MathRound(pKwatr * WATRmax);
     StepSizeMid = MathRound(pKwatr * 0.5 * (WATRmax + WATRmin));
     //----
     SizeMin = StepSizeMin * point;
     SizeMax = StepSizeMax * point;
     SizeMid = StepSizeMid * point;
     //----
     SizeMin2 = 2 * SizeMin;
     SizeMax2 = 2 * SizeMax;
     SizeMid2 = 2 * SizeMid;
     //----
     low = Low[bar];
     high = High[bar];
     close = Close[bar];
	  //----
	  if (HighLow > 0)
	   {
	    SmaxMin0 = low + SizeMin2;
	    SminMin0 = high - SizeMin2;
	    //----
	    SmaxMax0 = low + SizeMax2;
	    SminMax0 = high - SizeMax2;
	    //----
	    SmaxMid0 = low + SizeMid2;
	    SminMid0 = high - SizeMid2;
	    //----
	    if(close > SmaxMin1) TrendMin = 1;
	    if(close < SminMin1) TrendMin = -1;
	    //----
	    if(close > SmaxMax1) TrendMax = 1;
	    if(close < SminMax1) TrendMax = -1;
	    //----
	    if(close > SmaxMid1) TrendMid = 1;
	    if(close < SminMid1) TrendMid = -1;
	   }
	  //----
	  if (HighLow == 0)
	   {
	    SmaxMin0 = close + SizeMin2;
	    SminMin0 = close - SizeMin2;
	    //----
	    SmaxMax0 = close + SizeMax2;
	    SminMax0 = close - SizeMax2;
	    //----
	    SmaxMid0 = close + SizeMid2;
	    SminMid0 = close - SizeMid2;
	    //----
	    if(close > SmaxMin1)
	                    TrendMin = 1;
	    if(close < SminMin1)
	                    TrendMin = -1;
	    //----
	    if(close > SmaxMax1)
	                    TrendMax = 1;
	    if(close < SminMax1)
	                    TrendMax = -1;
	    //----
	    if(close > SmaxMid1)
	                    TrendMid = 1;
	    if(close < SminMid1)
	                    TrendMid = -1;
	   }
	  //----
	  if(TrendMin > 0 && SminMin0 < SminMin1)
	                               SminMin0 = SminMin1;
	  if(TrendMin < 0 && SmaxMin0 > SmaxMin1)
	                               SmaxMin0 = SmaxMin1;

	  if(TrendMax > 0 && SminMax0 < SminMax1)
	                               SminMax0 = SminMax1;
	  if(TrendMax < 0 && SmaxMax0 > SmaxMax1)
	                               SmaxMax0 = SmaxMax1;

	  if(TrendMid > 0 && SminMid0 < SminMid1)
	                               SminMid0 = SminMid1;
	  if(TrendMid < 0 && SmaxMid0 > SmaxMid1)
	                               SmaxMid0 = SmaxMid1;
	  //----
	  if (TrendMin > 0)
	            linemin = SminMin0 + SizeMin;
	  if (TrendMin < 0)
	            linemin = SmaxMin0 - SizeMin;

	  if (TrendMax > 0)
	            linemax = SminMax0 + SizeMax;
	  if (TrendMax < 0)
	            linemax = SmaxMax0 - SizeMax;

	  if (TrendMid > 0)
	            linemid = SminMid0 + SizeMid;
	  if (TrendMid < 0)
	            linemid = SmaxMid0 - SizeMid;
	  //----
	  bsmin = linemax - SizeMax;
	  bsmax = linemax + SizeMax;
	  //----
	  Stoch1 = (linemin - bsmin) / (bsmax - bsmin);
	  Stoch2 = (linemid - bsmin) / (bsmax - bsmin);
	  //----
	  LineMinBuffer[bar] = Stoch1;
	  LineMidBuffer[bar] = Stoch2;
	  //----
	  SminMin1 = SminMin0;
	  SmaxMin1 = SmaxMin0;
	  //----
	  SminMax1 = SminMax0;
	  SmaxMax1 = SmaxMax0;
	  //----
	  SminMid1 = SminMid0;
	  SmaxMid1 = SmaxMid0;
	 }
	return(0);
 }
//+---+ +X----------------------------------------------------------X+
Comments