StepRSI_v5.2_v2
Download script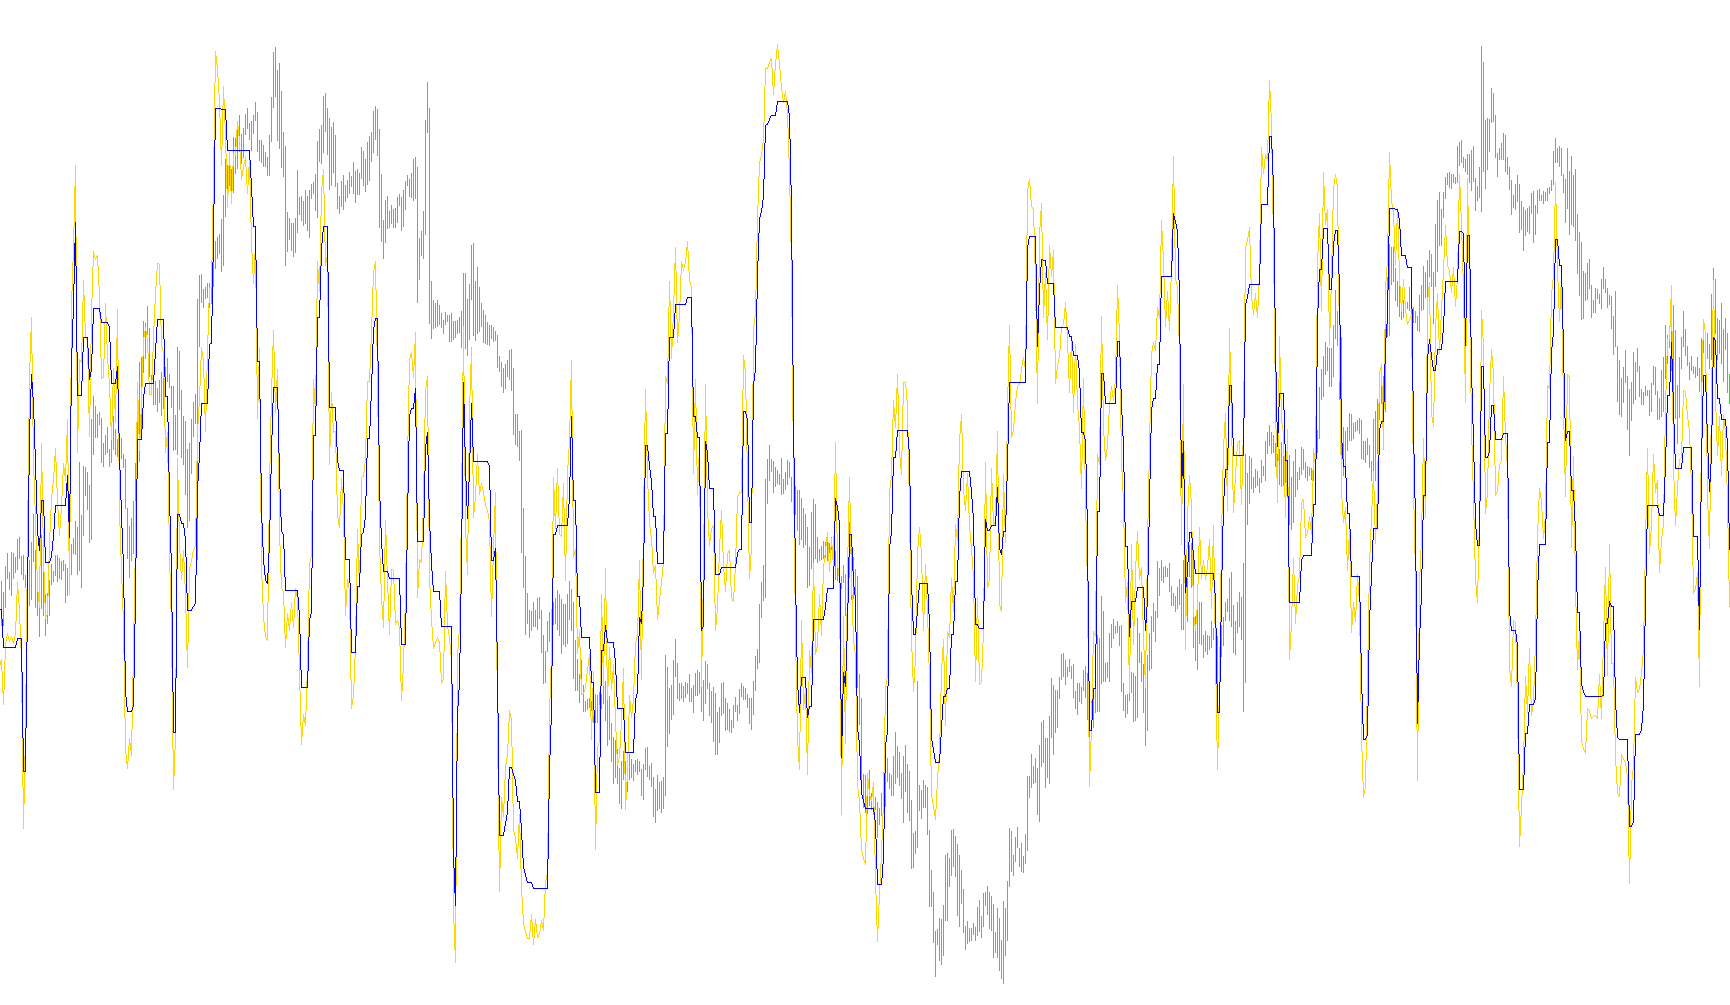
The StepRSI indicator is a sophisticated technical analysis tool designed to filter out the "noise" and minor fluctuations typically found in standard momentum oscillators. By combining the Relative Strength Index (RSI) with a unique "step-based" logic, it aims to provide traders with a clearer visualization of significant trend shifts rather than constant, jagged movements.
Core Logic Overview
The script operates through three primary stages: calculating price momentum, determining the trend direction, and applying a "step" filter to smooth out the visual data.
1. Momentum Calculation
The foundation of the indicator is based on how much an asset's price moves up versus how much it moves down over a specific period.
- In its default mode, it calculates the balance between positive and negative gains.
- It transforms these movements into a relative strength value (similar to a standard RSI), which usually fluctuates between 0 and 100. This tells you if an asset is currently being "pushed" more by buyers or sellers.
2. Trend Detection and Thresholds
Unlike a standard RSI that moves fluidly, this script looks for specific "breakout" conditions. It establishes boundaries based on the user-defined StepSize.
- The logic tracks the current trend direction (upward or downward).
- A trend is only considered to have changed if the price momentum exceeds a certain threshold relative to its previous position.
- If the momentum pushes beyond these established "steps," the indicator registers a new trend state.
3. The "Step" Smoothing Mechanism
The most distinct feature of this script is how it handles the final output line (the "Fast" buffer). Instead of showing every tiny fluctuation in the RSI:
- In an Upward Trend: The indicator holds its position or moves up in distinct increments. It remembers the lowest point reached during the current trend and adds a fixed value to that point to determine the next step.
- In a Downward Trend: It tracks the highest point reached during the move and subtracts a fixed value to determine the next downward step.
Summary for the Trader
Essentially, this indicator acts as a trend-stabilizer. While a normal RSI might look like a zigzagging mountain range, the StepRSI attempts to turn that movement into a series of deliberate "stairs."
By using this logic, traders can more easily identify when a momentum move is truly accelerating or exhausting. It ignores small, insignificant price wiggles and only reacts when the market provides enough strength to "step" onto a new level of momentum.
//+------------------------------------------------------------------+
//|                                                 StepRSI_v5.2.mq4 |
//|                                  Copyright © 2006, Forex-TSD.com |
//|                         Written by IgorAD,igorad2003@yahoo.co.uk |
//|            http://finance.groups.yahoo.com/group/TrendLaboratory |
//+------------------------------------------------------------------+
#property copyright "Copyright © 2006, Forex-TSD.com "
#property link      "http://www.forex-tsd.com/"
//----
#property indicator_separate_window
#property indicator_minimum 20
#property indicator_maximum 80
#property indicator_level1 40
#property indicator_level2 60
#property indicator_buffers 2
#property indicator_color1 DodgerBlue
#property indicator_color2 Yellow
//---- input parameters
extern int RSIPeriod=14;
extern double StepSize=5;
extern int MAPeriod=1;
extern int Price=0;
extern int Mode=1;
//---- buffers
double RSIBuffer[];
double FastBuffer[];
double trend[];
double smax[],smin[];
//---
int limit;
//+------------------------------------------------------------------+
//|                                                                  |
//+------------------------------------------------------------------+
   double StepMACalc (double Size, int k)
  {
   int count, counted_bars=IndicatorCounted();
   double result;
//----
   smax[k]=RSIBuffer[k] +2.0*Size;
   smin[k]=RSIBuffer[k] -2.0*Size;
   trend[k]=trend[k+1];
//----
   if (trend[k+1]<=0 && RSIBuffer[k]>smax[k+1]) trend[k]=1;
   if (trend[k+1]>=0 && RSIBuffer[k]<smin[k+1]) trend[k]=-1;
   if(trend[k]>0)
     {
      if(smin[k]<smin[k+1]) smin[k]=smin[k+1];
      result=smin[k]+Size;
     }
   else
      if(trend[k]<0)
        {
         if(smax[k]>smax[k+1]) smax[k]=smax[k+1];
         result=smax[k]-Size;
        }
   return(result);
  }
//+------------------------------------------------------------------+
//| Custom indicator initialization function                         |
//+------------------------------------------------------------------+
int init()
  {
   string short_name;
//---- 2 additional buffers are used for counting.
   IndicatorBuffers(5);
//---- indicator line
   SetIndexStyle(0,DRAW_LINE);
   SetIndexBuffer(0,RSIBuffer);
   SetIndexStyle(1,DRAW_LINE);
   SetIndexBuffer(1,FastBuffer);
   SetIndexBuffer(2,smin);
   SetIndexBuffer(3,smax);
   SetIndexBuffer(4,trend);
//---- name for DataWindow and indicator subwindow label
   short_name="StepRSI("+RSIPeriod+","+MAPeriod+","+Price+","+DoubleToStr(StepSize,1)+")";
   IndicatorShortName(short_name);
   SetIndexLabel(0,short_name);
   SetIndexLabel(1,"Fast");
//----
   SetIndexDrawBegin(0,RSIPeriod);
   SetIndexDrawBegin(1,RSIPeriod);
//----
   return(0);
  }
//+------------------------------------------------------------------+
//| StepRSI_v5.2                                                     |
//+------------------------------------------------------------------+
int start()
  {
   int    count,i,counted_bars=IndicatorCounted();
   double rel,negative,positive;
//----
   if(Bars<=RSIPeriod) return(0);
//---- initial zero
   if(counted_bars<1)
      for(i=1;i<=RSIPeriod;i++)
      {RSIBuffer[Bars-i]=0.0;FastBuffer[Bars-i]=0.0;}
//----
   if(counted_bars > 0) limit=Bars-counted_bars;
   if(counted_bars ==0) limit=Bars-RSIPeriod-1;
   for(i=limit;i>=0;i--)
     {
      double sumn=0.0,sump=0.0;
      for(int k=RSIPeriod-1;k>=0;k--)
        {
         rel=iMA(NULL,0,MAPeriod,0,MODE_SMA,Price,i+k)-iMA(NULL,0,MAPeriod,0,MODE_SMA,Price,i+k+1);
         if(rel>0) sump+=rel;
         else      sumn-=rel;
        }
      positive=sump/RSIPeriod;
      negative=sumn/RSIPeriod;
      if (Mode==1)
        {
         if(negative==0.0) RSIBuffer[i]=100.0;
         else
            RSIBuffer[i]=100.0-100.0/(1.0+positive/negative);
        }
      else
         RSIBuffer[i]=iRSI(NULL,0,RSIPeriod,Price,i);
      FastBuffer[i]=StepMACalc(StepSize,i);
     }
//----
   return(0);
  }
//+------------------------------------------------------------------+
Comments