Stochastic-q
Download script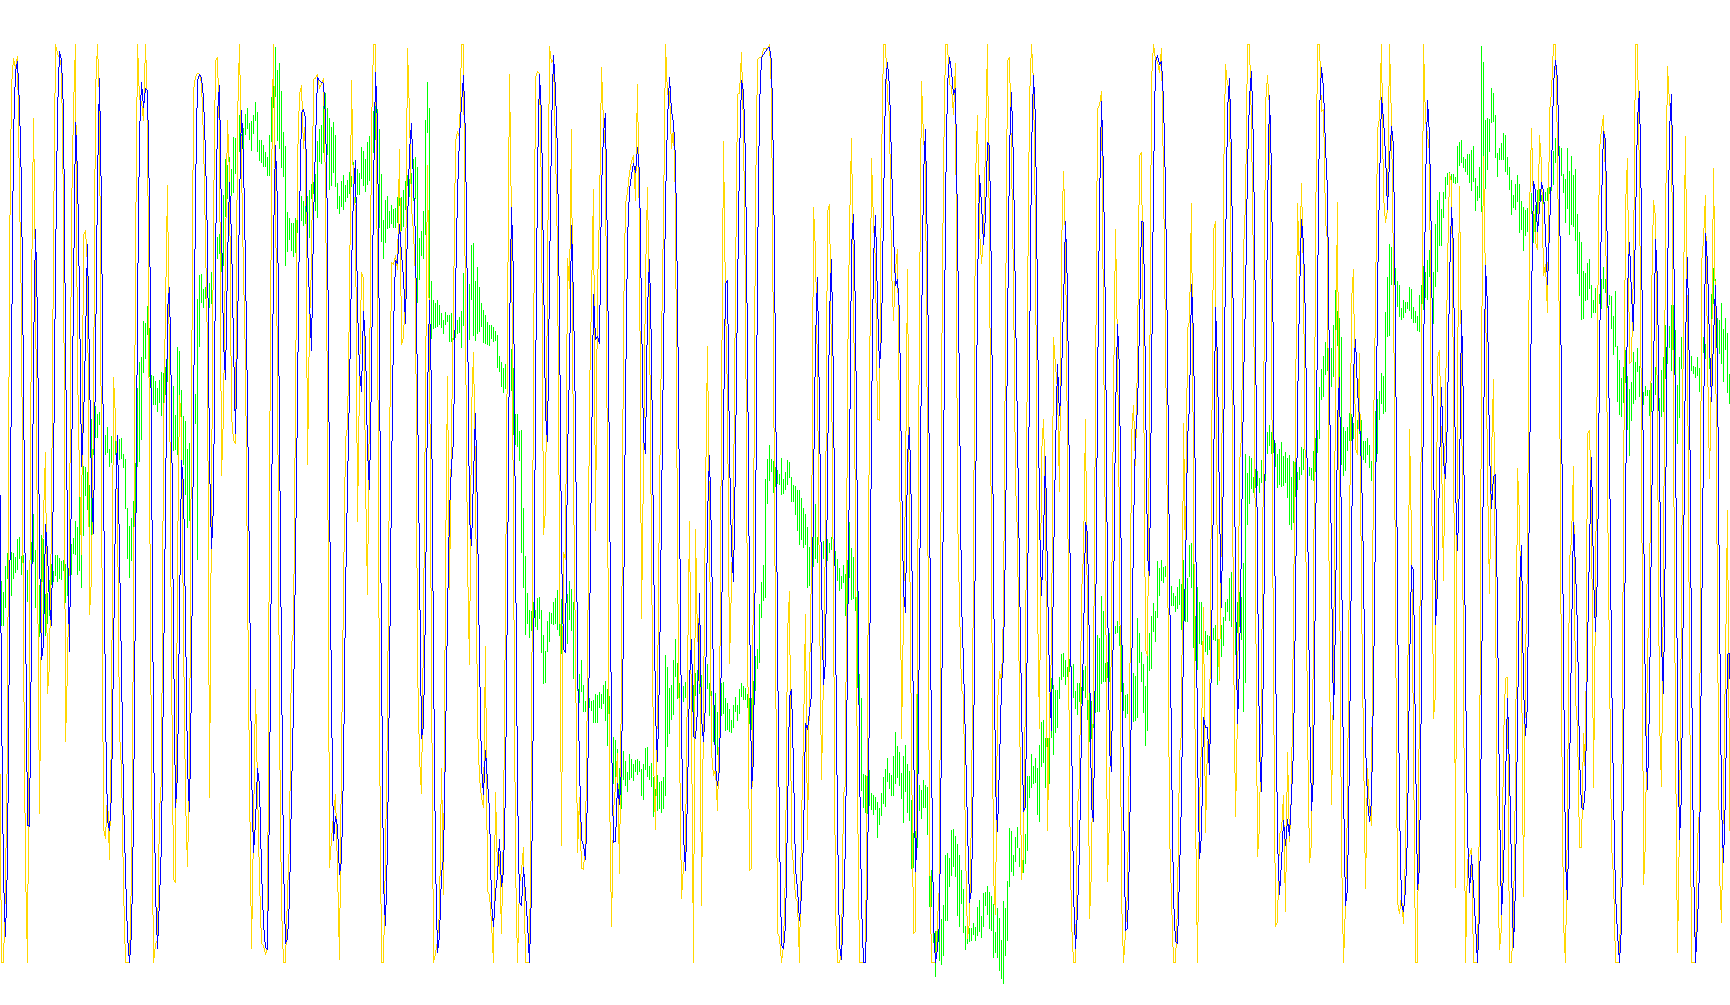
This tool is a technical analysis indicator designed to help traders gauge the momentum of a financial asset. It works by determining whether a price is currently "overbought" (trading too high compared to its recent history) or "oversold" (trading too low).
To achieve this, the script follows a multi-step logic process:
1. Establishing Historical Benchmarks
The script first looks back at a specific number of previous price candles (defined by your settings). During this lookback period, it identifies two critical values:
- The Lowest Point: The minimum price reached within that timeframe.
- The Highest Point: The maximum price reached within that timeframe.
2. Calculating the Relative Position (%K Line)
Once the highest and lowest points are identified, the script calculates where the current price sits in between them. It essentially asks: "Where is the price currently located relative to its recent highs and lows?"
- This result is expressed as a percentage between 0 and 100.
- If the current price is near the recent high, the value will be close to 100.
- If it is near the recent low, the value will drop toward 0.
3. Smoothing the Data (The Signal Line)
Because raw price movements can be erratic and "noisy," the script performs a smoothing calculation on the percentage values derived in the previous step. It takes a Simple Moving Average of those percentages to create a secondary "Signal" line. This helps filter out minor fluctuations so that you can see the broader trend more clearly.
Summary for the User
The visual output consists of two lines:
- The Main Line: Shows the fast-moving momentum of the price.
- The Signal Line: A slower, smoother line that acts as a reference point.
By watching how these two lines interact and where they sit on the 0–100 scale, you can identify potential turning points in the market—helping you spot when a trend might be losing steam or when a price has moved significantly far from its recent average.
//+------------------------------------------------------------------+
//|                                                   Stochastic.mq4 |
//|                      Copyright © 2004, MetaQuotes Software Corp. |
//|                                       http://www.metaquotes.net/ |
//+------------------------------------------------------------------+
#property copyright "Copyright © 2004, MetaQuotes Software Corp."
#property link      "http://www.metaquotes.net/"

#property indicator_separate_window
#property indicator_minimum 0
#property indicator_maximum 100
#property indicator_buffers 2
#property indicator_color1 LightSeaGreen
#property indicator_color2 Red
//---- input parameters
extern int KPeriod=5;
extern int DPeriod=3;
extern int Slowing=3;
//---- buffers
double MainBuffer[];
double SignalBuffer[];
double HighesBuffer[];
double LowesBuffer[];
//----
int draw_begin1=0;
int draw_begin2=0;
//+------------------------------------------------------------------+
//| Custom indicator initialization function                         |
//+------------------------------------------------------------------+
int init()
  {
   string short_name;
//---- 2 additional buffers are used for counting.
   IndicatorBuffers(4);
   SetIndexBuffer(2, HighesBuffer);
   SetIndexBuffer(3, LowesBuffer);
//---- indicator lines
   SetIndexStyle(0,DRAW_LINE);
   SetIndexBuffer(0, MainBuffer);
   SetIndexStyle(1,DRAW_LINE);
   SetIndexBuffer(1, SignalBuffer);
//---- name for DataWindow and indicator subwindow label
   short_name="Sto("+KPeriod+","+DPeriod+","+Slowing+")";
   IndicatorShortName(short_name);
   SetIndexLabel(0,short_name);
   SetIndexLabel(1,"Signal");
//----
   draw_begin1=KPeriod+Slowing;
   draw_begin2=draw_begin1+DPeriod;
   SetIndexDrawBegin(0,draw_begin1);
   SetIndexDrawBegin(1,draw_begin2);
//----
   return(0);
  }
//+------------------------------------------------------------------+
//| Stochastic oscillator                                            |
//+------------------------------------------------------------------+
int start()
  {
   int    i,k;
   int    counted_bars=IndicatorCounted();
   double price, rsi;
//----
   if(Bars<=draw_begin2) return(0);
//---- initial zero
   if(counted_bars<1)
     {
      for(i=1;i<=draw_begin1;i++) MainBuffer[Bars-i]=0;
      for(i=1;i<=draw_begin2;i++) SignalBuffer[Bars-i]=0;
     }
//---- minimums counting
   i=Bars-KPeriod;
   if(counted_bars>KPeriod) i=Bars-counted_bars-1;
   while(i>=0)
     {
      double min=1000000;
      k=i+KPeriod-1;
      while(k>=i)
        {
         price=iRSI( NULL, 0, 9, PRICE_CLOSE, k );
         if(min>price) min=price;
         k--;
        }
      LowesBuffer[i]=min;
      i--;
     }
//---- maximums counting
   i=Bars-KPeriod;
   if(counted_bars>KPeriod) i=Bars-counted_bars-1;
   while(i>=0)
     {
      double max=-1000000;
      k=i+KPeriod-1;
      while(k>=i)
        {
         price=iRSI( NULL, 0, 9, PRICE_CLOSE, k );
         if(max<price) max=price;
         k--;
        }
      HighesBuffer[i]=max;
      i--;
     }
//---- %K line
   i=Bars-draw_begin1;
   if(counted_bars>draw_begin1) i=Bars-counted_bars-1;
   while(i>=0)
     {
      double sumlow=0.0;
      double sumhigh=0.0;
      for(k=(i+Slowing-1);k>=i;k--)
        {
         sumlow+=iRSI( NULL, 0, 9, PRICE_CLOSE, k )-LowesBuffer[k];
         sumhigh+=HighesBuffer[k]-LowesBuffer[k];
        }
      if(sumhigh==0.0) MainBuffer[i]=100.0;
      else MainBuffer[i]=sumlow/sumhigh*100;
      i--;
     }
//---- last counted bar will be recounted
   if(counted_bars>0) counted_bars--;
   int limit=Bars-counted_bars;
//---- signal line is simple movimg average
   for(i=0; i<limit; i++)
      SignalBuffer[i]=iMAOnArray(MainBuffer,Bars,DPeriod,0,MODE_SMA,i);
//----
   return(0);
  }
//+------------------------------------------------------------------+
Comments