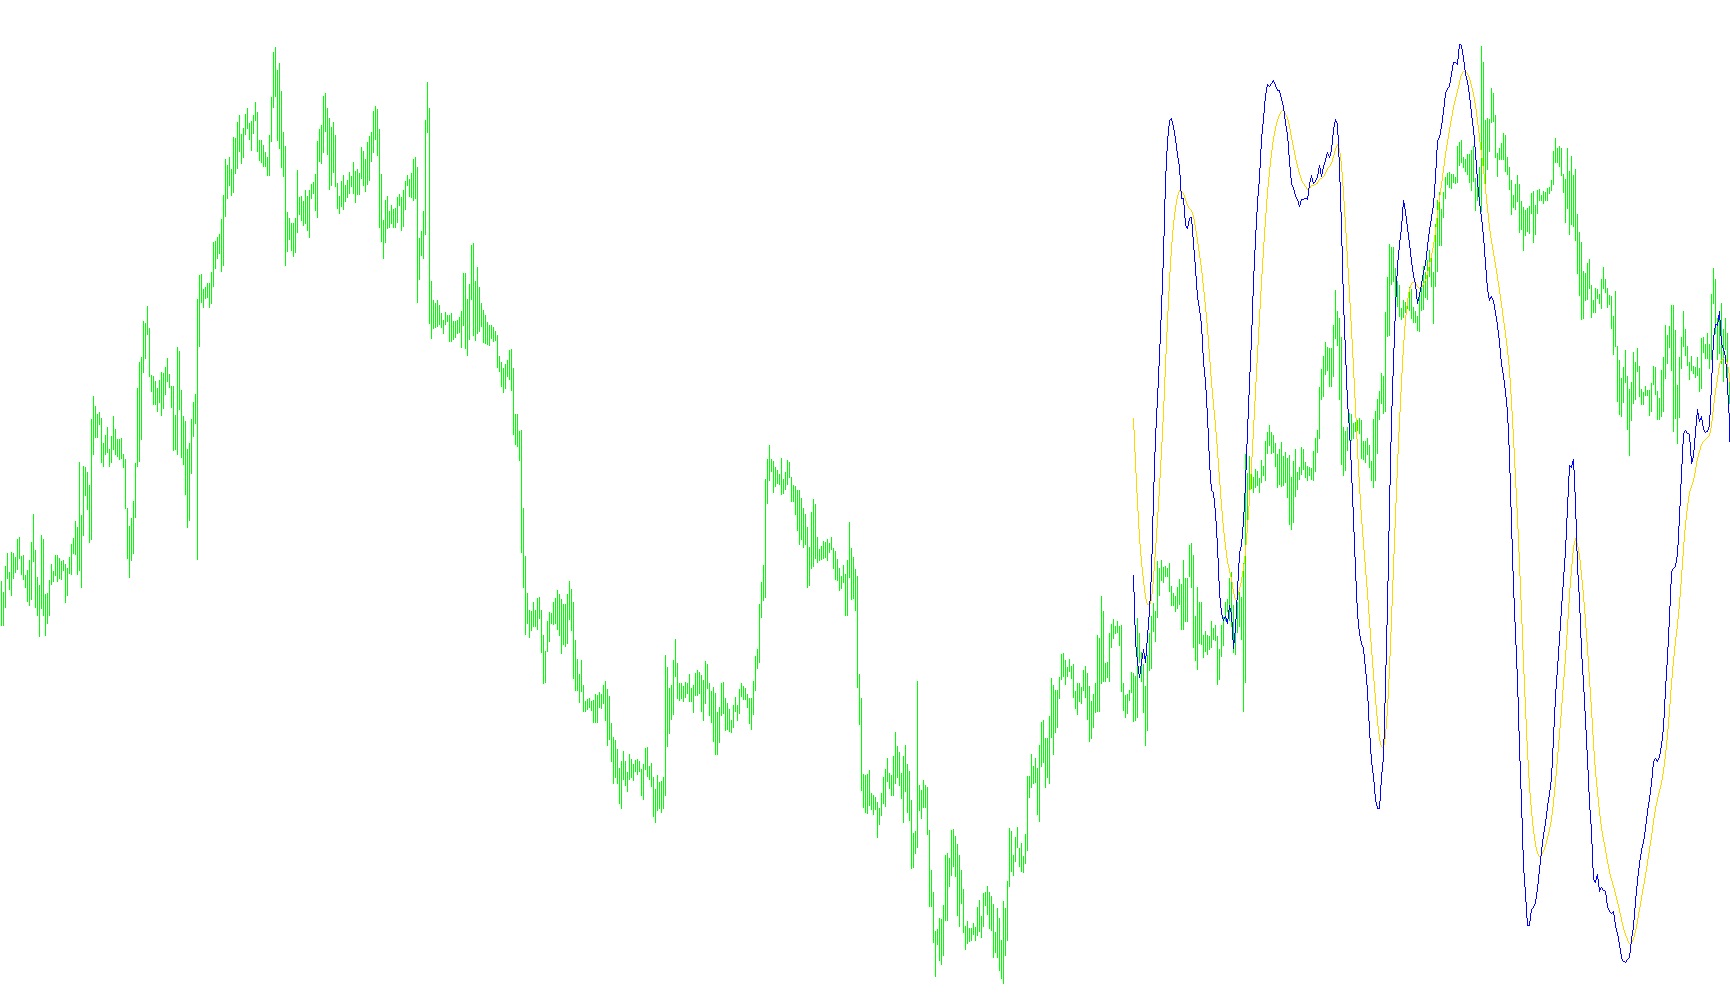
The Stochastic Tape is a specialized technical analysis tool designed to visualize momentum trends and price sentiment in a more intuitive, graphic format. Instead of relying solely on standard lines and numbers, this script translates complex mathematical calculations into a dynamic "tape" of visual cues.
How the Logic Works
1. Core Data Analysis At its foundation, the script utilizes the Stochastic Oscillator—a momentum indicator that compares a specific closing price to its range over a set period. It tracks two primary components:
- The Main Line: Represents the general momentum of the market.
- The Signal Line: Acts as a smoothed average of the main line to identify potential trend reversals or continuations.
2. Visual Translation (The "Tape") The unique logic of this script lies in how it presents this data. Rather than just plotting two overlapping lines, it analyzes the relationship between these two values:
- Trend Identification: The script compares the Main Line to the Signal Line at every point in time.
- Dynamic Coloring: If the Main Line is above the Signal Line, the script recognizes upward momentum and renders a green "tape" segment. Conversely, if the Main Line falls below the Signal Line, it interprets this as downward momentum and renders a red "tape" segment.
3. Real-Time Rendering The script continuously scans a specific number of past bars (customizable by the user) to draw these segments. It creates a continuous visual flow that allows a trader to see the "heartbeat" of the market momentum at a glance. By looking at the colors of the tape, you can quickly identify whether the current price action is trending bullishly or bearishly without having to manually interpret crossing lines.
Key Features for the User
- Customizable Sensitivity: Users can adjust the periods (KPeriod, Slowing, and DPeriod) to make the tape more responsive to fast price movements or smoother for long-term trends.
- Visual Clarity: By using distinct colors (Red/Green), it simplifies the decision-making process, turning complex oscillator data into a clear visual summary of market direction.
- Automatic Management: The script handles all the "heavy lifting" by automatically creating, updating, and cleaning up the visual objects on your chart as new data arrives.
//+------------------------------------------------------------------+
//|                                              Stochastic tape.mq4 |
//|                                                           mladen |
//+------------------------------------------------------------------+
#property copyright "mladen"
#property link      ""

#property indicator_separate_window
#property indicator_buffers   2
#property indicator_color1    DimGray
#property indicator_color2    Lime
#property indicator_minimum   0
#property indicator_maximum 100
#property indicator_level1   80
#property indicator_level2   20
#property indicator_levelcolor DimGray

//
//
//
//
//

extern int   KPeriod       = 34;
extern int   Slowing       = 10;
extern int   DPeriod       =  5;
extern int   MAMethod      =  2;
extern int   PriceField    =  0;
extern int   BarsToCount   = 300;
extern bool  ShowTape      = true;
extern color TapeColorUp   = Green;
extern color TapeColorDown = Red;
extern int   TapeBarsWidth = 1;

//
//
//
//
//

double StocBuffer[];
double SignBuffer[];
double EmaBuffer1[];
double EmaBuffer2[];
double EmaBuffer3[];
string shortName;
int    Window;
int    WindowID;


//+------------------------------------------------------------------+
//|                                                                  |
//+------------------------------------------------------------------+

int init()
{
   IndicatorBuffers(5);
   SetIndexBuffer(0,SignBuffer);
   SetIndexBuffer(1,StocBuffer);
   SetIndexBuffer(2,EmaBuffer1);
   SetIndexBuffer(3,EmaBuffer2);
   SetIndexBuffer(4,EmaBuffer3);

   //
   //
   //
   //
   //

   WindowID     = MathRand();
   BarsToCount  = MathMax(BarsToCount,300);
   shortName    = "Stochastic tape("+KPeriod+","+DPeriod+","+Slowing+" : "+WindowID+")";

   //
   //
   //
   //
   //

   IndicatorShortName(shortName);
   return(0);
}

int deinit()
{
   DeleteTape();
   return(0);
}


//+------------------------------------------------------------------+
//|                                                                  |
//+------------------------------------------------------------------+

int start()
{
   int    counted_bars=IndicatorCounted();
   int    limit,i;


   if(counted_bars<0) return(-1);
   if(counted_bars>0) counted_bars--;
         limit  = Bars-counted_bars;
         CheckWindow();

   //
   //
   //
   //
   //

   for (i=limit;i>=0;i--)
      {
          StocBuffer[i] = iStochastic(NULL,0,KPeriod,DPeriod,Slowing,MAMethod,PriceField,MODE_MAIN,i);
          SignBuffer[i] = iStochastic(NULL,0,KPeriod,DPeriod,Slowing,MAMethod,PriceField,MODE_SIGNAL,i);
      }

   //
   //
   //
   //
   //

   DeleteTape();
   if (ShowTape) for (i=0; i<BarsToCount ;i++) DrawTape(StocBuffer[i],SignBuffer[i],i);

   //
   //
   //
   //
   //

   for (i=0;i<indicator_buffers;i++) SetIndexDrawBegin(i,Bars-BarsToCount);
   return(0);
}


//+------------------------------------------------------------------+
//|                                                                  |
//+------------------------------------------------------------------+

#define SignalName "StocTape"
    int maxLines = 0;

//
//
//
//
//

void DrawTape(double __1, double __2,int shift)
{
   if (__1==__2) return;

   //
   //
   //
   //
   //

   maxLines++;
      datetime time = Time[shift];
      string   name = StringConcatenate(SignalName,WindowID,"-",maxLines);

      ObjectCreate(name,OBJ_TREND,Window,time,__1,time,__2);
         if (__1>__2)
               ObjectSet(name,OBJPROP_COLOR ,TapeColorUp);
         else  ObjectSet(name,OBJPROP_COLOR ,TapeColorDown);
         ObjectSet(name,OBJPROP_RAY   ,false);
         ObjectSet(name,OBJPROP_BACK  ,true);
         ObjectSet(name,OBJPROP_WIDTH ,TapeBarsWidth);
}
void DeleteTape()
{
   string name = StringConcatenate(SignalName,WindowID);
      while(maxLines>0) { ObjectDelete(StringConcatenate(name,"-",maxLines)); maxLines--; }
                          ObjectDelete(name);
}


//+------------------------------------------------------------------+
//|                                                                  |
//+------------------------------------------------------------------+

void CheckWindow()
{
   string name = StringConcatenate(SignalName,WindowID);

   //
   //
   //
   //
   //

   Window = WindowFind(shortName);
   if(Window == -1) {
      Window = ObjectFind(name);
      if(Window == -1) {
         Window = WindowOnDropped();
            ObjectCreate(name,OBJ_TEXT,Window,0,0);
      }
   }
}
Comments