StochCCI_Arrows_v7
Download script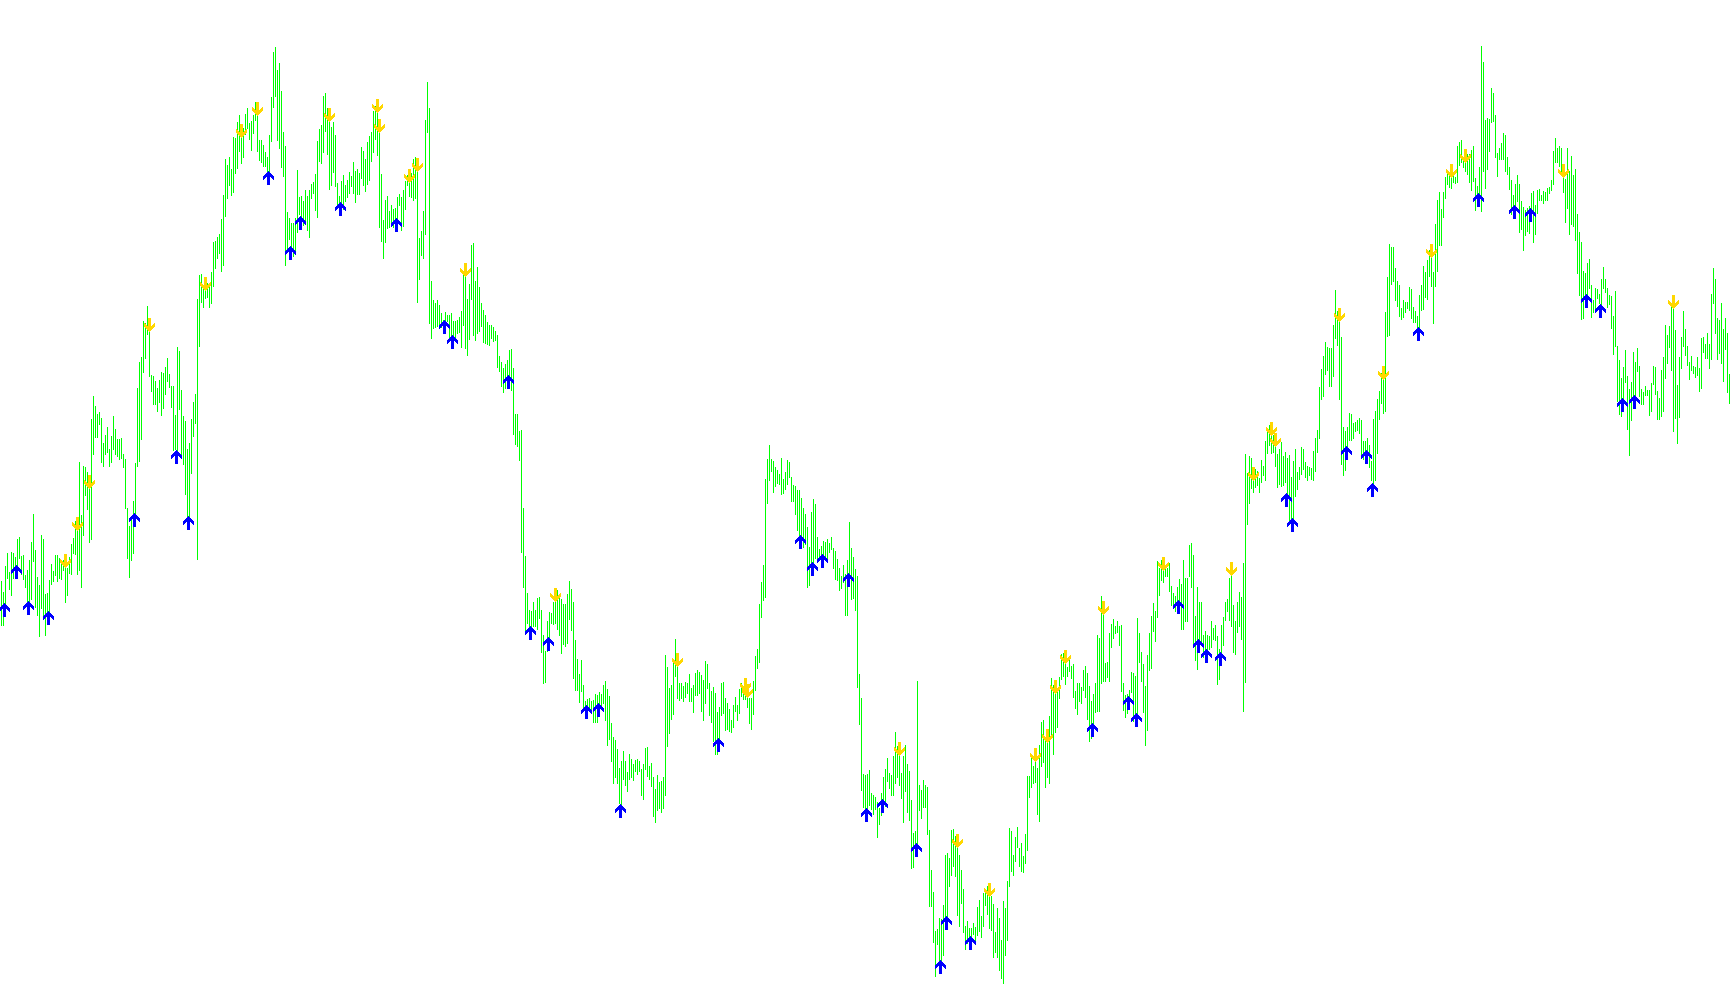
This technical indicator is designed to provide visual trading signals on a price chart by analyzing three distinct momentum and trend oscillators simultaneously. Instead of relying on a single data point, the logic looks for specific "confluences"—moments where multiple mathematical conditions align to suggest a potential change in market direction.
Core Components of the Logic
The script monitors three primary indicators to validate every signal:
- Stochastic Oscillators (Fast and Slow): These measure the relationship between recent price movements and past price averages to identify overbought or oversold conditions. The script uses two different speeds for these to ensure the signal isn't just a temporary "blip" but part of a broader momentum shift.
- Commodity Channel Index (CCI): This is used to detect new trends by measuring how far the current price is deviating from its average. The script checks both the "Fast" and "Slow" variations of this index to confirm that price momentum is moving in the desired direction.
How Signals are Generated
The indicator automatically places visual arrows on your chart based on specific mathematical rules:
Sell Signals (Bearish): A Sell arrow appears when the market shows signs of losing upward momentum and starting to retreat. The logic triggers if:
- The "Slow" Stochastic signal moves from an overbought state (above 80) back downward.
- The current momentum is lower than the previous bar.
- The CCI confirms that the faster price movement is trailing below the slower average. Essentially, it looks for a "turning point" where the price has had enough upward energy and is beginning to exhaust.
Buy Signals (Bullish): A Buy arrow appears when the market shows signs of recovering from a downward trend. The logic triggers if:
- The "Slow" Stochastic signal moves from an oversold state (below 20) back upward.
- The current momentum is higher than the previous bar.
- The CCI confirms that the faster price movement is rising above the slower average. Essentially, it identifies moments where the selling pressure has dried up and the price is gaining new strength.
Summary for the Trader
Rather than giving you a signal every time a price moves slightly, this script acts as a filter. It waits for three different types of market "proof" (Stochastic momentum, Stochastic trend direction, and CCI price deviation) to agree with each other before placing an arrow on the chart. This helps in identifying high-probability reversal points where multiple technical factors align toward the same outcome.
//+------------------------------------------------------------------+

//+------------------------------------------------------------------+

#property copyright "Gideon Smolders copyright 2007"
#property link      "MetaTrader Group"

#property indicator_chart_window
#property indicator_buffers 3
#property indicator_color1 Coral
#property indicator_color2 White


//---- input parameters


extern int RSIfast         =3;
extern int RSIslow         =10;

extern int StochFast       =4;
extern int StochSlow       =10;

extern int CCIperiod       =34;

//---- buffers

double ExtMapBuffer0[];
double ExtMapBuffer1[];
double ExtMapBuffer2[];

//+------------------------------------------------------------------+
//| Custom indicator initialization function                         |
//+------------------------------------------------------------------+

int init()
  {
//---- indicators

   IndicatorBuffers(3);

   SetIndexEmptyValue(0,0.0);
   SetIndexStyle(0,DRAW_ARROW);
   SetIndexArrow(0,234);
   SetIndexBuffer(0,ExtMapBuffer0);

   SetIndexEmptyValue(1,0.0);
   SetIndexStyle(1,DRAW_ARROW);
   SetIndexArrow(1,233);
   SetIndexBuffer(1,ExtMapBuffer1);

   SetIndexEmptyValue(2,0.0);
   SetIndexStyle(2,DRAW_ARROW);
   SetIndexArrow(2,172);
   SetIndexBuffer(2,ExtMapBuffer2);

   IndicatorShortName("RSI_Arrows");

//----
   return(0);
  }

//+------------------------------------------------------------------+
//| Custor indicator deinitialization function                       |
//+------------------------------------------------------------------+

int deinit()
  {
//----

//----
   return(0);
  }

//+------------------------------------------------------------------+
//| Custom indicator iteration function                              |
//+------------------------------------------------------------------+

int start()
  {

//----
   for (int i=Bars-50; i>=0; i--)
      {

      double prevtime;
      if (prevtime != Time[0]) { RefreshRates(); prevtime=Time[0]; }

      double StochSignal0 = iStochastic(Symbol(),0,StochFast,StochFast,1,MODE_LWMA,1,MODE_SIGNAL,i);
      double StochSignal1 = iStochastic(Symbol(),0,StochFast,StochFast,1,MODE_LWMA,1,MODE_SIGNAL,i+1);

      double StochSignal0slow = iStochastic(Symbol(),0,StochSlow,StochSlow,1,MODE_LWMA,1,MODE_SIGNAL,i);
      double StochSignal1slow = iStochastic(Symbol(),0,StochSlow,StochSlow,1,MODE_LWMA,1,MODE_SIGNAL,i+1);

      double CCIslow0 = iCCI(Symbol(),0,7,PRICE_OPEN,i);
      double CCIslow1 = iCCI(Symbol(),0,7,PRICE_OPEN,i+1);

      double CCIfast0 = iCCI(Symbol(),0,7,PRICE_CLOSE,i);
      double CCIfast1 = iCCI(Symbol(),0,7,PRICE_CLOSE,i+1);

      //- Sell Arrows ---
      if (
         (StochSignal0slow<80 && StochSignal1slow>80 && StochSignal0<StochSignal1 && CCIfast0<CCIslow0)||
         (StochSignal0<80 && StochSignal1>80 && StochSignal0<StochSignal0slow && StochSignal1>StochSignal1slow && CCIfast0<CCIslow0)
         )
         ExtMapBuffer0[i]=High[i]+(5*Point);//High arrow Sell

      //- Buy Arrows ----
      if (
         (StochSignal0slow>20 && StochSignal1slow<20 && StochSignal0>StochSignal1 && CCIfast0>CCIslow0)||
         (StochSignal0>20 && StochSignal1<20 && StochSignal0>StochSignal0slow && StochSignal1<StochSignal1slow && CCIfast0>CCIslow0)
         )
         ExtMapBuffer1[i]=Low[i]-(5*Point);//Low arrow Buy


      }

//----
   return(0);
  }
//+------------------------------------------------------------------+
Comments