StocRSI 2_v1
Download script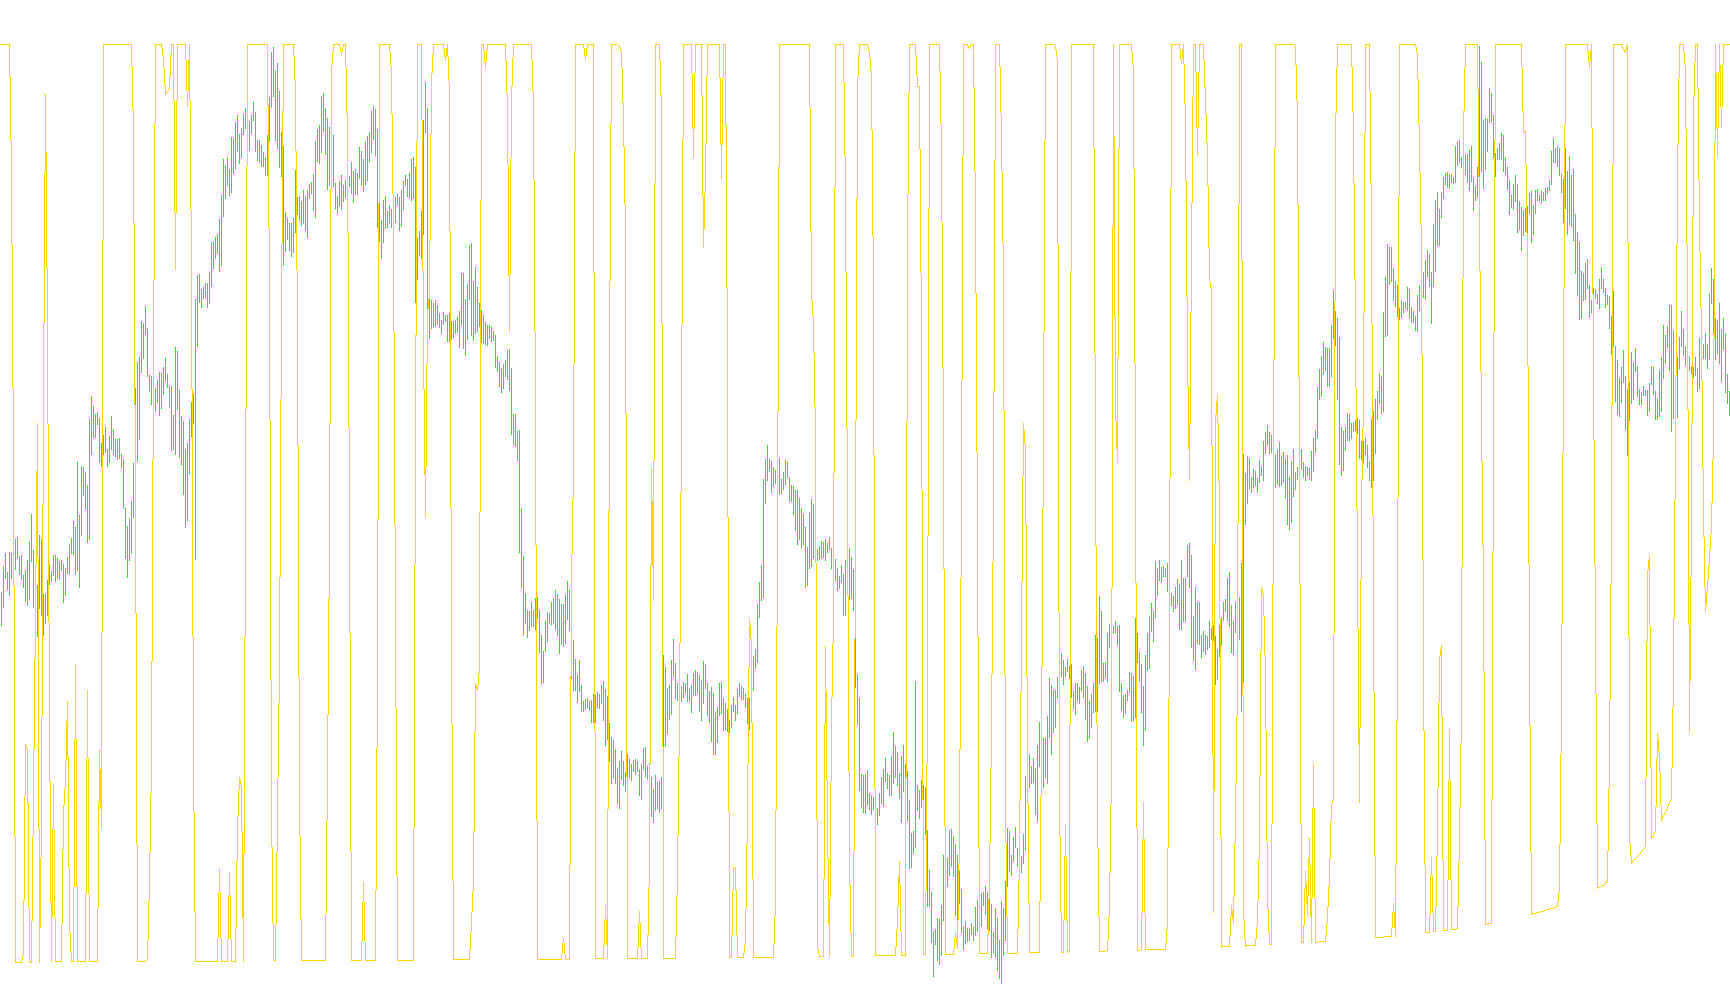
This technical indicator is designed to provide a customized visual signal by blending two well-known momentum analysis tools: the Relative Strength Index (RSI) and the Stochastic Oscillator. By combining these metrics, the script aims to identify price trends and potential overbought or oversold conditions with a smoothed, filtered output.
Core Analytical Logic
The script processes market data through three distinct layers of calculation:
1. The Movement Calculation (RSI Foundation) Instead of looking at raw prices alone, the logic first analyzes the "upward" and "downward" movement of the market over a specific period. It identifies every price increase and decrease independently, calculates their averages, and uses these to determine a ratio. This is essentially building a custom version of the RSI, which measures the speed and change of price movements.
2. The Range Analysis (Stochastic Integration) Once the initial momentum ratio is established, the script applies a "Stochastic" approach. It looks back at a set window of time to identify the highest high and the lowest low reached by that momentum ratio. It then determines where the current value sits relative to that range. This tells the user if the current momentum is reaching an extreme point (near the top or bottom) compared to its recent history.
3. The Smoothing Filter To prevent the indicator from being too "choppy" or reactive to minor market noise, the logic applies a final smoothing pass. It uses a weighted calculation over a small period to refine the result. Additionally, it contains a specific condition where, if the calculated value is not positive, it carries forward the previous value. This helps maintain visual continuity on the chart and prevents erratic jumps in the data line.
Key Features for the User
- Trend Awareness: By utilizing the RSI-style averages, the indicator highlights whether the prevailing momentum is shifting upward or downward.
- Boundary Detection: By incorporating Stochastic logic, it helps users see when the current trend is becoming "overextended" relative to its recent peaks and troughs.
- Visual Stability: The smoothing mechanisms ensure that the resulting line on your chart provides a readable, fluid path rather than a jagged series of unpredictable points.
/*-----------------------------+
|			       |
| Shared by www.Aptrafx.com    |
|			       |
+------------------------------*/

//+------------------------------------------------------------------+
//|                                                    StocRSI 2.mq4 |
//|                                                     Emerald King |
//|                                     mailto:info@emerald-king.com |
//+------------------------------------------------------------------+
#property copyright "Emerald King"
#property link      "mailto:info@emerald-king.com"

#property indicator_separate_window
#property indicator_color1 Red
//---- input parameters
extern int Len1=8;
extern int Len2=8;
extern int Len3=5;
extern int CountBars=950;

double CU = 0;
double CD = 0;
double CUAve = 0;
double CDAve = 0;
double CUAveB = 0;
double CDAveB = 0;
double Count = 0;
double RSI0[1000];
double HiR = 0;
double LoR = 0;
double StocR = 0;
double StocRSI = 0;
double Price = 0;
int x = 0;
double TempA = 0;
double TempB = 0;
double TempC = 0;
int Lookback = 0;

double val1[];
//+------------------------------------------------------------------+
//| Custom indicator initialization function                         |
//+------------------------------------------------------------------+
int init()
  {
//---- indicators
//----
   Lookback = MathMax(Len1, Len2);
   Lookback = MathMax(Lookback, Len3);
   SetIndexBuffer(0,val1);
   return(0);
  }
//+------------------------------------------------------------------+
//| Custor indicator deinitialization function                       |
//+------------------------------------------------------------------+
int deinit()
  {
//---- TODO: add your code here

//----
   return(0);
  }
//+------------------------------------------------------------------+
//| Custom indicator iteration function                              |
//+------------------------------------------------------------------+
int start()
  {
   if (CountBars>Bars) CountBars=Bars;
   SetIndexDrawBegin(0,Bars-CountBars+Lookback);

   int i;
   int    counted_bars=IndicatorCounted();

   if(CountBars<=Lookback) return(0);
   //---- initial zero
   if(counted_bars<1)
   {
      for(i=1;i<=Lookback;i++) val1[CountBars-i]=0.0;
   }

   i=CountBars-Lookback-1;
   while(i>=0)
   {
      CU = 0;
      CD = 0;
      CUAveB = CUAve;
      CDAveB = CDAve;

      for (x=i; x<i+Len1-1;x++)
      {
         if (Close[x] > Close[x + 1]) CU = CU + (Close[x] - Close[x + 1]);
         if (Close[x] < Close[x + 1]) CD = CD + (Close[x + 1] - Close[x]);
      }


      CU = CU / Len1;
      CD = CD / Len1;
      CUAve = CU;
      CDAve = CD;

      if ((CUAve + CDAve) != 0) RSI0[i] = CUAve / (CUAve+ CDAve);
      if (i > Lookback)
      {
         CUAve = (CUAveB *(Len1 - 1) + CU) / Len1;
         CDAve = (CDAveB *(Len1 - 1) + CD) / Len1;
      }

      if ((CUAve + CDAve) != 0) RSI0[i] = CUAve / (CUAve+ CDAve);

      for (x=i; x<i+Len2-1; x++)
      {
         if ( x==i )
         {
            TempA = RSI0[x];
            TempB = RSI0[x];
         }

         if ( RSI0[x] > TempA )
            TempA = RSI0[x];
         if ( RSI0[x] < TempB )
            TempB = RSI0[x];
      }

      HiR = TempA;
      LoR = TempB;

      if (HiR != LoR) StocR = (RSI0[i] - LoR)/ (HiR - LoR);

      StocRSI = 0;
      TempC = 0;

      for (x=i; x<i+Len3-1;x++)
      {
         StocRSI = StocRSI + (Len3 - x) * StocR;
         TempC = TempC + (x+1);
      }

      if ( TempC != 0 ) StocRSI = StocRSI / TempC;

      if ( StocRSI > 0 )
         val1[i] = val1[i+1];
      else
         val1[i] = StocRSI;
	  i--;
	}
   return(0);
 }
//+------------------------------------------------------------------+
Comments