StrangeIndicator
Download script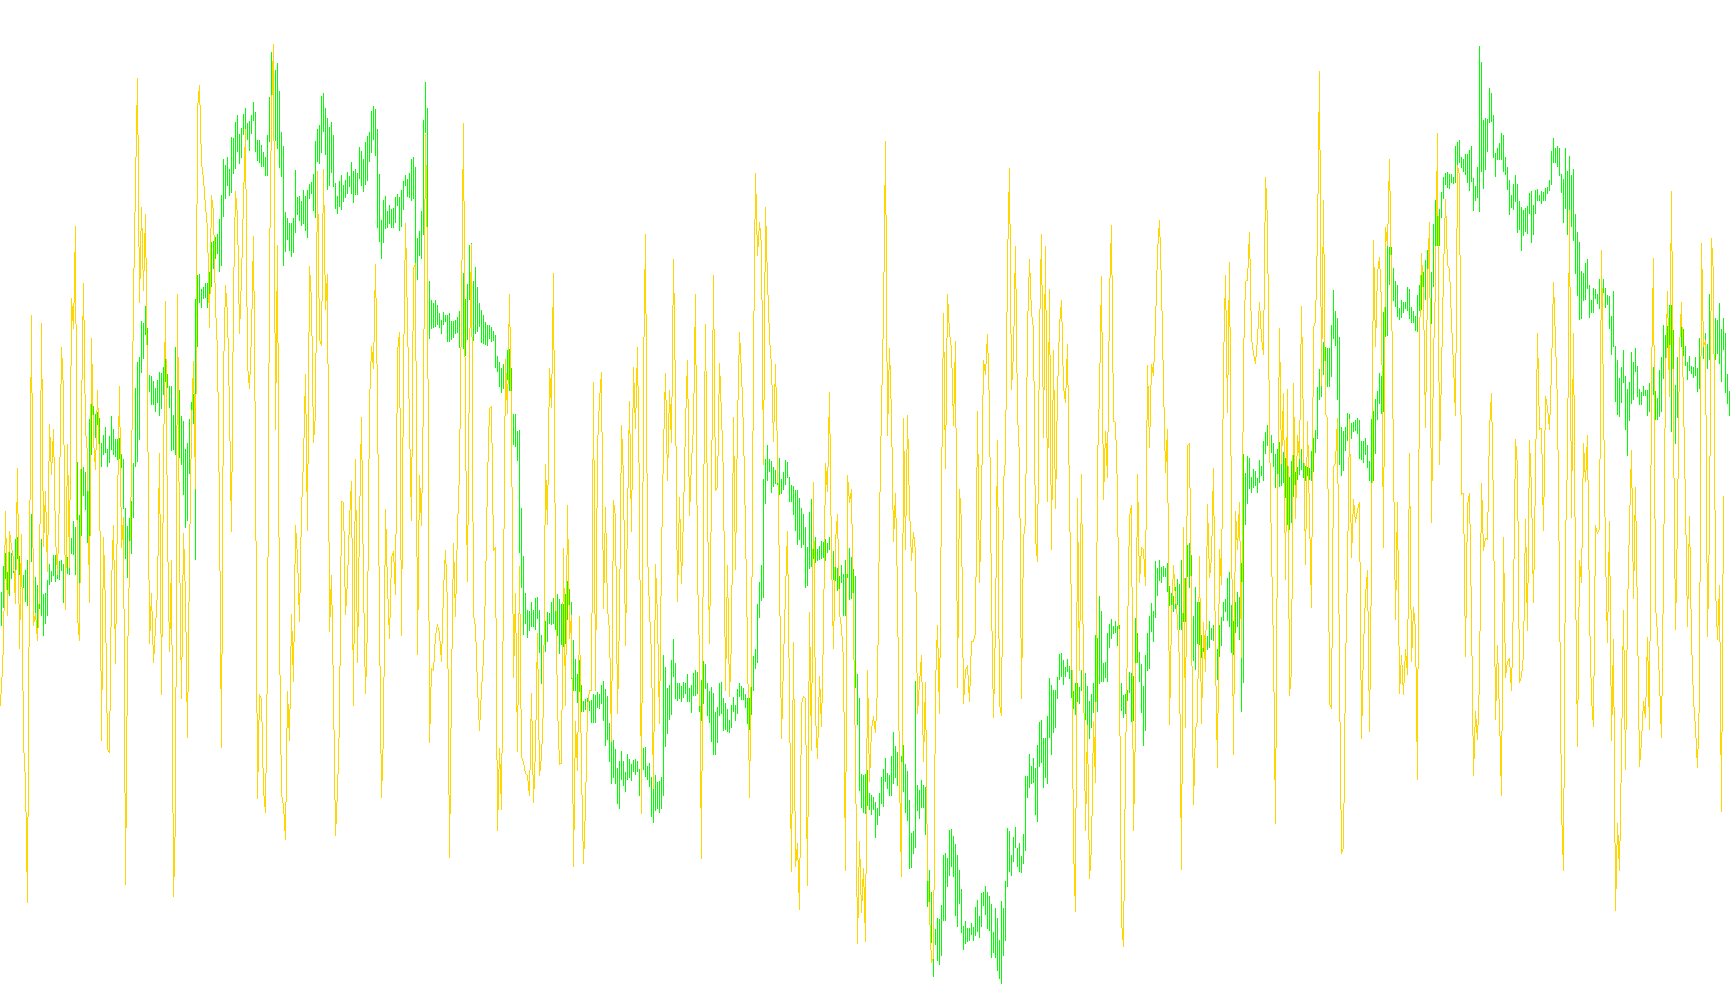
This custom indicator is designed to provide a visual representation of price momentum and relative positioning within a specific timeframe. Rather than plotting the raw price of an asset, it calculates a percentage-based value that illustrates where the current price sits relative to its recent historical range.
Core Logic and Methodology
The script operates by analyzing three distinct types of "Moving Averages" simultaneously. Instead of looking at simple price points, it focuses on the following components:
- The High Average: The average of the highest prices over a user-defined period.
- The Low Average: The average of the lowest prices over the same period.
- The Closing Average: The average of the closing prices over that period.
How the Calculation Works
To determine the value shown on your chart, the script performs a multi-step calculation:
- Range Identification: It first establishes the total "trading range" by finding the difference between the Average High and the Average Low.
- Positioning: It then identifies the distance between the Average Closing price and the Average Low.
- Percentage Conversion: Finally, it calculates what percentage of that total range the closing price occupies.
Visual Interpretation
The resulting data is displayed in a separate window as a continuous line. This allows traders to observe the "strength" of a move in real-time:
- A higher value on the indicator suggests that the price is trending toward the upper end of its recent range (potential bullish strength).
- A lower value suggests the price is gravitating toward the bottom of its recent range (potential bearish pressure).
By using Moving Averages as the basis for this calculation rather than raw price points, the indicator filters out "market noise," providing a smoother representation of price trends and relative positioning.
//+------------------------------------------------------------------+
//|                                             StrangeIndicator.mq4 |
//|                            MT4 realization created by CrazyChart |
//|                                    mailto:newcomer2003@yandex.ru |
//+------------------------------------------------------------------+
#property copyright "MT4 realization created by CrazyChart"
#property link      "mailto:newcomer2003@yandex.ru"

#property indicator_separate_window
#property indicator_buffers 1
#property indicator_color1 Blue
//---- input parameters
extern int       shift=5;
//---- buffers
double ExtMapBuffer1[];


//+------------------------------------------------------------------+
//| Custom indicator initialization function                         |
//+------------------------------------------------------------------+
int init()
  {
//---- indicators
   SetIndexStyle(0,DRAW_LINE);
   SetIndexBuffer(0,ExtMapBuffer1);
//----
   return(0);
  }
//+------------------------------------------------------------------+
//| Custor indicator deinitialization function                       |
//+------------------------------------------------------------------+
int deinit()
  {
//---- TODO: add your code here

//----
   return(0);
  }
//+------------------------------------------------------------------+
//| Custom indicator iteration function                              |
//+------------------------------------------------------------------+
int start()
  {
   int    counted_bars=IndicatorCounted();
//---- TODO: add your code here
   int cb=1;
   int Ma534, Ma,ma7,cb1,min1,max1,c7;
   double EMAclose,EMAhigh,EMAlow,ma3;


for (cb = 1;cb<=Bars;cb++) {
/*
period: number of periods for calculation
ma_method: mode of calculation (MODE_SMA,MODE_EMA,MODE_SMMA,MODE_LWMA)
ma_shift: MA shift
applied_price: applied price (PRICE_CLOSE,PRICE_OPEN,PRICE_HIGH,PRICE_LOW,PRICE_MEDIAN,PRICE_TYPICAL,PRICE_WEIGHTED)
shift: shift relative to the current bar (number of periods back), where the data is to be taken from
*/


EMAclose=iMA(NULL,0,shift,0,MODE_EMA,PRICE_CLOSE,cb);
EMAlow=iMA(NULL,0,shift,0,MODE_EMA,PRICE_LOW,cb);
EMAhigh=iMA(NULL,0,shift,0,MODE_EMA,PRICE_HIGH,cb);

ma3=(EMAclose-EMAlow)/(EMAhigh-EMAlow)*100;
//ma3=(close[cb]-low[cb])/(high[cb]-low[cb])*100;

ExtMapBuffer1[cb-1]=ma3;

}


//----
   return(0);
  }
//+------------------------------------------------------------------+
Comments