Super_Trend2_v2
Download script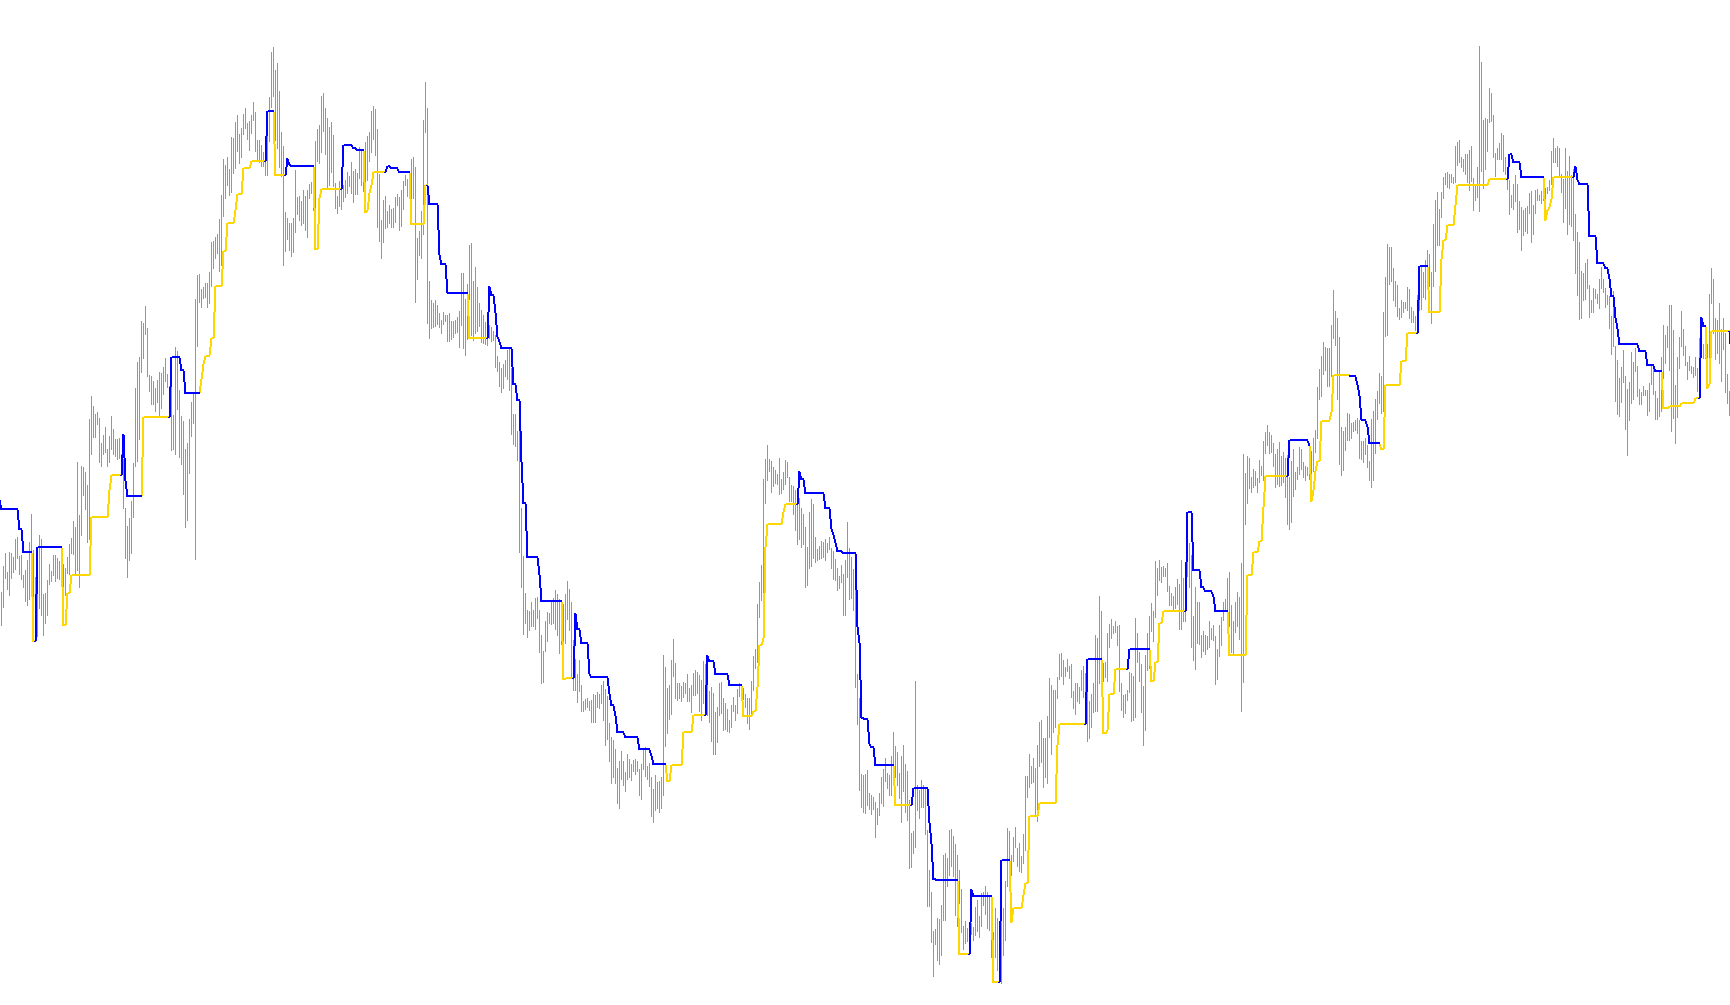
This script is designed as a visual technical analysis tool for the MetaTrader platform. Its primary purpose is to identify and display market trends dynamically, helping traders distinguish between "bullish" (upward) and "bearish" (downward) price movements on a chart.
Core Logic and Functionality
1. Timeframe Adaptation The script features an intelligent setting that allows it to adjust automatically based on the timeframe you are viewing (e.g., 1-minute, 1-hour, daily, etc.). This ensures that the calculations remain relevant whether you are performing quick scalping or long-term swing trading, as it scales the data "periods" to match the specific speed of the chart.
2. Dual-Price Analysis To determine the trend, the logic calculates two distinct types of average prices based on a user-defined period:
- Current Average: It looks at the most recent price action (High, Low, and Close) over a specific number of bars.
- Previous Average: It looks at the price action immediately preceding the current period. By comparing these two averages, the script can sense whether the momentum is shifting forward or backward.
3. Trend Identification The tool categorizes the market into three primary states:
- Upward Trend: Visualized primarily in lime green, appearing when the current price momentum is significantly higher than previous benchmarks.
- Downward Trend: Visualized primarily in red, appearing when the current price momentum falls below previous benchmarks.
- Average Price Line: An optional visual aid that can display a balanced middle ground between the two price averages.
4. The "SuperTrend" Logic The most sophisticated part of this script is its trend-following line logic. Rather than just changing colors, it calculates a "buffer" or "boundary" using volatility (ATR - Average True Range).
- In an uptrend, it creates a support line below the price. It uses specific logic to ensure this line only moves in one direction—it will stay flat or move up, but won't drop suddenly unless the trend officially flips. This prevents "false signals" caused by minor price fluctuations.
- In a downtrend, it creates a resistance line above the price. Similarly, this line is designed to remain steady or move lower, acting as a ceiling for the price action.
5. Visual Output For the end user, this logic translates into smooth lines on the chart:
- When the trend flips from bearish to bullish, the red line disappears and a lime green line appears.
- The lines "trail" the price, providing a clear visual boundary that helps traders stay on the right side of the market movement without getting caught in "noise."
//+------------------------------------------------------------------+
//|                                                       strend.mq4 |
//|                   Copyright © 2005, Jason Robinson (jnrtrading). |
//|                                      http://www.jnrtrading.co.uk |
//+------------------------------------------------------------------+
#property copyright "Copyright © 2005, Jason Robinson (jnrtrading)."
#property link      "http://www.jnrtrading.co.uk"

#property indicator_chart_window
#property indicator_buffers 3
#property indicator_color1 Lime
#property indicator_color2 Red
#property indicator_color3 Orange

double TrendUp[], TrendDown[], Price1[], Price2[], AvgPrice[], Trend[];
int UpDownShift;
double price1, price2;

extern int NbPeriods = 10;
extern bool Display_SuperTrend = true;
extern bool Display_Average_Price_Line = false;
extern bool Automatic_Timeframe_Settings = false;
extern int M1_NbPeriods = 10;
extern int M5_NbPeriods = 10;
extern int M15_NbPeriods = 10;
extern int M30_NbPeriods = 10;
extern int H1_NbPeriods = 10;
extern int H4_NbPeriods = 10;
extern int D1_NbPeriods = 10;
extern int W1_NbPeriods = 10;
extern int MN_NbPeriods = 10;
//+------------------------------------------------------------------+
//| Custom indicator initialization function                         |
//+------------------------------------------------------------------+
int init()
  {
//---- indicators

   IndicatorBuffers(6);
   SetIndexBuffer(0, TrendUp);
   SetIndexStyle(0, DRAW_LINE, STYLE_SOLID, 2);
   SetIndexBuffer(1, TrendDown);
   SetIndexStyle(1, DRAW_LINE, STYLE_SOLID, 2);
   SetIndexBuffer(2, AvgPrice);
   SetIndexStyle(2, DRAW_LINE, STYLE_SOLID, 2);
   SetIndexBuffer(3, Price1);
   SetIndexBuffer(4, Price2);
   SetIndexBuffer(5, Trend);

   /*switch(Period()) {
      case 1:     UpDownShift = 5;   break;
      case 5:     UpDownShift = 9;  break;
      case 15:    UpDownShift = 10;   break;
      case 30:    UpDownShift = 11;   break;
      case 60:    UpDownShift = 30;  break;
      case 240:   UpDownShift = 45;  break;
      case 1440:  UpDownShift = 55;  break;
      case 10080: UpDownShift = 150; break;
      case 43200: UpDownShift = 350; break;
   }*/
//----
   return(0);
  }
//+------------------------------------------------------------------+
//| Custor indicator deinitialization function                       |
//+------------------------------------------------------------------+
int deinit()
  {
//----

//----
   return(0);
  }
//+------------------------------------------------------------------+
//| Custom indicator iteration function                              |
//+------------------------------------------------------------------+
int start()
  {
   int limit, i, j, shift;
   double Price3;
   int counted_bars = IndicatorCounted();
//---- check for possible errors
   if(counted_bars < 0) return(-1);
//---- last counted bar will be recounted
   if(counted_bars > 0) counted_bars--;

   limit=Bars-counted_bars;

   if (Automatic_Timeframe_Settings == true) {
      switch(Period()) {
         case 1:     NbPeriods = M1_NbPeriods;   break;
         case 5:     NbPeriods = M5_NbPeriods;  break;
         case 15:    NbPeriods = M15_NbPeriods;   break;
         case 30:    NbPeriods = M30_NbPeriods;   break;
         case 60:    NbPeriods = H1_NbPeriods;  break;
         case 240:   NbPeriods = H4_NbPeriods;  break;
         case 1440:  NbPeriods = D1_NbPeriods;  break;
         case 10080: NbPeriods = W1_NbPeriods; break;
         case 43200: NbPeriods = MN_NbPeriods; break;
      }
   }

   for (i = limit; i >= 0; i--) {
      Price1[i] = 0;
      Price2[i] = 0;
      for(j = 0; j < NbPeriods; j++) {
         Price1[i] = Price1[i] + ((High[i+j] + Low[i+j] + Close[i+j])/3);
      }
      Price1[i] = Price1[i] / NbPeriods;
      for(j = NbPeriods; j < (NbPeriods*2); j++) {
         Price2[i] = Price2[i] + ((High[i+j] + Low[i+j] + Close[i+j])/3);
      }
      Price2[i] = Price2[i] / NbPeriods;
   }
   for (i = limit; i >= 0; i--) {
      if (Price1[i] > Price2[i]) Trend[i] = 90;
      if (Price1[i] < Price2[i]) Trend[i] = 10;
      if (Trend[i+1] > Trend[i] && Trend[i+1] > Trend[i+2]) Trend[i+1] = 10;
      if (Trend[i+1] < Trend[i] && Trend[i+1] < Trend[i+2]) Trend[i+1] = 90;
   }
   for (i = limit; i >= 0; i--) {
      price1 = (High[i] + Low[i] + Close[i])/3;
      price2 = (High[i+1] + Low[i+1] + Close[i+1])/3;
      if (Display_Average_Price_Line == true) AvgPrice[i] = (Price1[i] + Price2[i])/2;
      if (Display_SuperTrend == true) {
         if(Trend[i] == 90) {
            TrendDown[i] = EMPTY_VALUE;
            if(TrendDown[i+1] != EMPTY_VALUE) TrendUp[i+1] = TrendDown[i+1];
            TrendUp[i] = Low[i] - iATR(NULL,0,10,i);// Point*UpDownShift;
            if (price1 < price2 && TrendDown[i+1] != TrendUp[i+1]) TrendUp[i] = TrendUp[i+1];
            if (Close[i] < Close[i+1] && TrendDown[i+1] != TrendUp[i+1]) TrendUp[i] = TrendUp[i+1];
            if (High[i] < High[i+1] && TrendDown[i+1] != TrendUp[i+1]) TrendUp[i] = TrendUp[i+1];
            if (TrendUp[i] < TrendUp[i+1] && TrendUp[i+1] != TrendDown[i+1]) TrendUp[i] = TrendUp[i+1];
         }
         if(Trend[i] == 10) {
            TrendUp[i] = EMPTY_VALUE;
            if(TrendUp[i+1] != EMPTY_VALUE) TrendDown[i+1] = TrendUp[i+1];
            TrendDown[i] = High[i] + iATR(NULL,0,10,i);// Point*UpDownShift;
            if (price1 > price2 && TrendDown[i+1] != TrendUp[i+1]) TrendUp[i] = TrendUp[i+1];
            if (Close[i] > Close[i+1] && TrendDown[i+1] != TrendUp[i+1]) TrendUp[i] = TrendUp[i+1];
            if (Low[i] > Low[i+1] && TrendUp[i+1] != TrendDown[i+1]) TrendDown[i] = TrendDown[i+1];
            if (TrendDown[i] > TrendDown[i+1] && TrendUp[i+1] != TrendDown[i+1]) TrendDown[i] = TrendDown[i+1];
         }
      }
   }
//----

//----
   return(0);
  }
//+------------------------------------------------------------------+
Comments