SuperTrend_32
Download script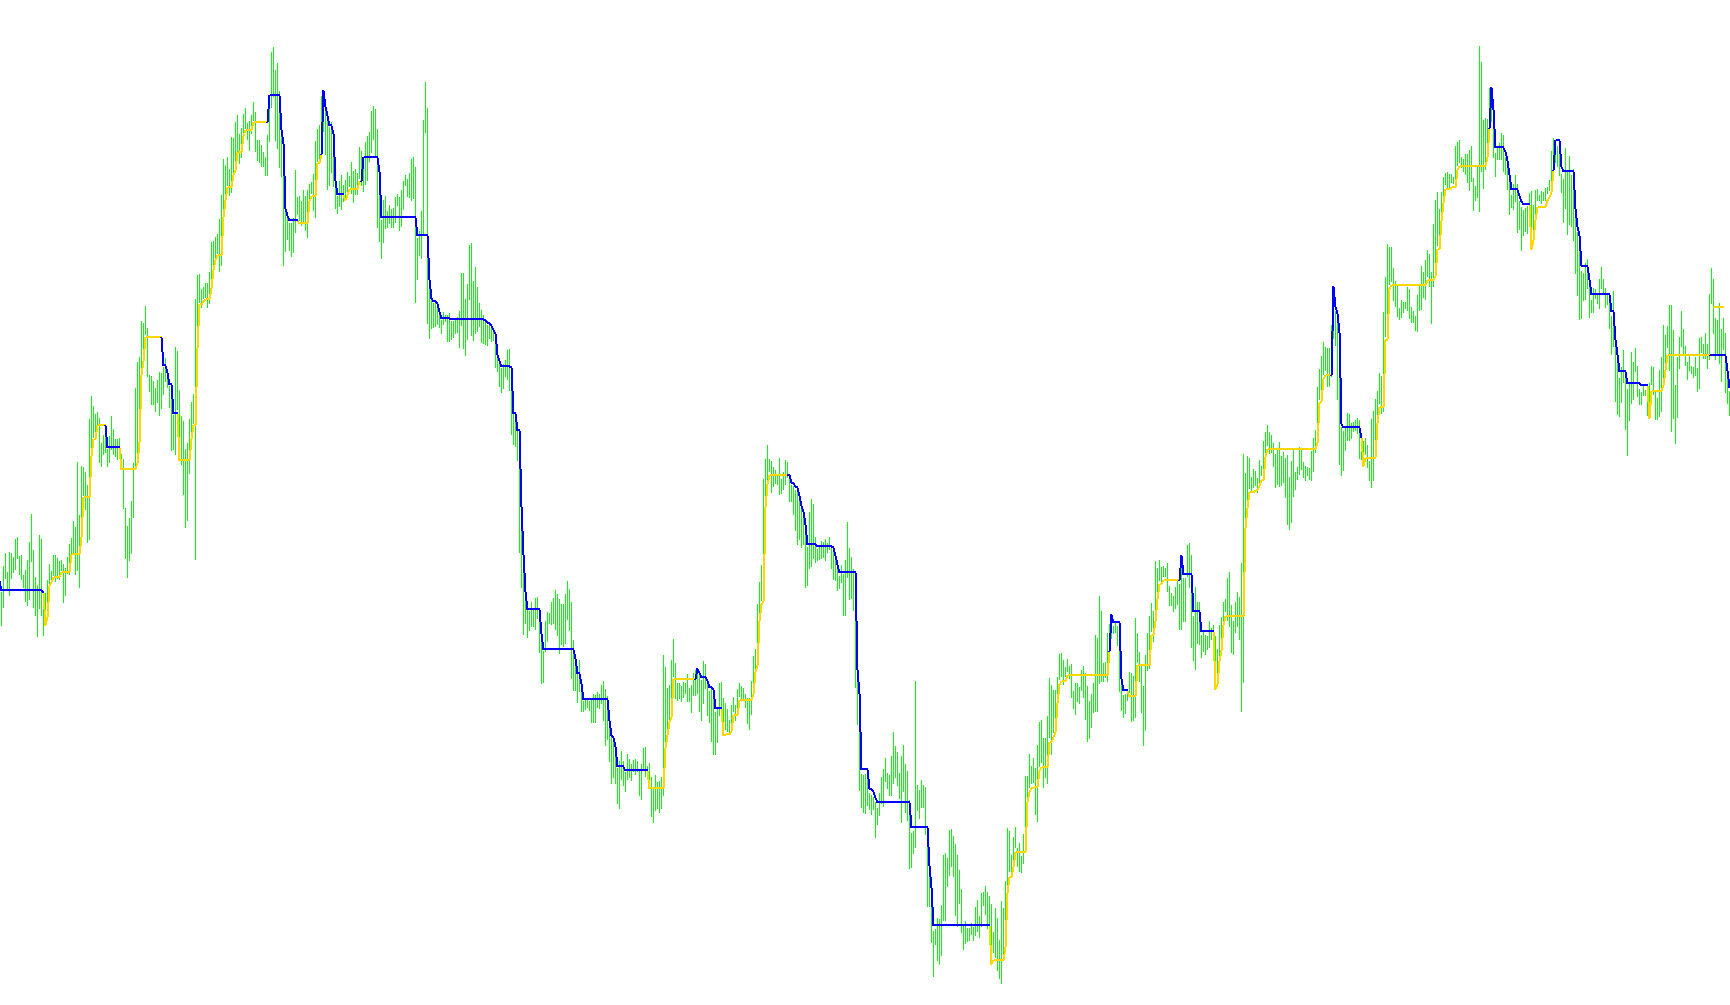
This script is designed to help traders identify and visualize the prevailing direction of the market—specifically whether the price is currently in an "uptrend" or a "downtrend." It does this by calculating a dynamic trend line that follows the price action while smoothing out minor fluctuations.
Core Logic Overview
The tool operates by comparing two different types of moving averages to determine the underlying momentum of the market.
- Trend Identification: The script looks at the relationship between a current moving average and a previous one. If the current average is higher than the previous one, it signals an upward bias. Conversely, if it is lower, it signals a downward bias.
- Dynamic Boundary Calculation: Rather than just drawing a static line, the script calculates a "buffer" or boundary around the price. It uses an Average True Range (ATR) calculation—which measures market volatility—to determine how far away from the price the trend line should sit.
How it Functions on Your Chart
Depending on the direction identified by the moving averages, the script behaves differently:
- In an Uptrend: The script focuses on identifying a "floor" or support level. It tracks the lowest prices but ensures the trend line never moves downward; if the price dips slightly but remains within the trend, the line stays steady. If it breaks below a certain point, the line adjusts to reflect the new reality.
- In a Downtrend: The script focuses on identifying a "ceiling" or resistance level. It tracks the highest prices and ensures the trend line never moves upward. It essentially creates a trailing barrier that follows the price as it drops.
Visual Experience
The indicator provides clear visual cues on your trading platform:
- When the market is trending up, you will see a specific line (colored Chartreuse) representing the support level.
- When the market shifts to a downtrend, the script switches its logic and displays a different line (colored Red) representing the resistance level.
By automating this logic, the script removes the guesswork of "eyeballing" the chart, providing a consistent visual guide that adjusts automatically based on both current price movement and historical volatility.
//+------------------------------------------------------+\\
//|         SuperTrend_3.mq4 Release 20061022-1          |\\
//|  Copyright © 2005-2006, jnrtrading (Jason Robinson)  |\\
//|   Contact @ http://www.spreadtrade2win.com/forum/    |\\
//+------------------------------------------------------+\\
#property copyright "Copyright © 2005, Jason Robinson (jnrtrading)."
#property link      "http://www.jnrtrading.co.uk"

#property indicator_chart_window
#property indicator_buffers 3
#property indicator_color1 Chartreuse
#property indicator_color2 Red

double TrendUp[], TrendDown[], MA[];
double MA1, MA2;
bool trendIsUp;

extern int Nb_Periods = 10;
extern double Multiplier = 2;
/*extern bool Automatic_Timeframe_Settings = false;
extern int M1_Nb_Periods = 10;
extern int M5_Nb_Periods = 10;
extern int M15_Nb_Periods = 12;
extern int M30_Nb_Periods = 10;
extern int H1_Nb_Periods = 10;
extern int H4_Nb_Periods = 10;
extern int D1_Nb_Periods = 10;
extern int W1_Nb_Periods = 10;
extern int MN_Nb_Periods = 10;*/
//+------------------------------------------------------------------+
//| Custom indicator initialization function                         |
//+------------------------------------------------------------------+
int init()
  {
//---- indicators

   IndicatorBuffers(3);
   SetIndexBuffer(0, TrendUp);
   SetIndexStyle(0, DRAW_LINE, STYLE_SOLID, 2);
   SetIndexBuffer(1, TrendDown);
   SetIndexStyle(1, DRAW_LINE, STYLE_SOLID, 2);

//----
   return(0);
  }
//+------------------------------------------------------------------+
//| Custor indicator deinitialization function                       |
//+------------------------------------------------------------------+
int deinit()
  {
//----

//----
   return(0);
  }
//+------------------------------------------------------------------+
//| Custom indicator iteration function                              |
//+------------------------------------------------------------------+
int start()
  {
   int limit, i, j, shift;
   //double Price3;
   int counted_bars = IndicatorCounted();
//---- check for possible errors
   if(counted_bars < 0) return(-1);
//---- last counted bar will be recounted
   if(counted_bars > 0) counted_bars--;

   limit=Bars-counted_bars;
   if (Multiplier == 0) Multiplier = 0.1;

   for (i = limit; i >= 0; i--) {
      MA1 = iMA(NULL, 0, Nb_Periods*Multiplier, 0, MODE_EMA, PRICE_TYPICAL, i);
      MA2 = iMA(NULL, 0, Nb_Periods*Multiplier, 0, MODE_EMA, PRICE_TYPICAL, i+Nb_Periods);

      if (MA1 >= MA2) {
         if (TrendDown[i+Nb_Periods+1] != EMPTY_VALUE && TrendUp[i+Nb_Periods+2] != EMPTY_VALUE) {
            TrendDown[i+Nb_Periods+1] = EMPTY_VALUE;
            TrendUp[i+Nb_Periods+1] = TrendUp[i+Nb_Periods+2];
         }
         TrendUp[i+Nb_Periods] = Low[i+Nb_Periods]-iATR(NULL,1,18,i);
         TrendDown[i+Nb_Periods] = EMPTY_VALUE;
         if(TrendDown[i+Nb_Periods+1] != EMPTY_VALUE) TrendUp[i+Nb_Periods+1] = TrendDown[i+Nb_Periods+1];
         if (TrendUp[i+Nb_Periods] < TrendUp[i+Nb_Periods+1] && TrendUp[i+Nb_Periods+1] != TrendDown[i+Nb_Periods+1]) TrendUp[i+Nb_Periods] = TrendUp[i+Nb_Periods+1];
         trendIsUp = true;
      }
      else if (MA1 <= MA2) {
         if (TrendUp[i+Nb_Periods+1] != EMPTY_VALUE && TrendDown[i+Nb_Periods+2] != EMPTY_VALUE) {
            TrendUp[i+Nb_Periods+1] = EMPTY_VALUE;
            TrendDown[i+Nb_Periods+1] = TrendDown[i+Nb_Periods+2];
         }
         TrendDown[i+Nb_Periods] = High[i+Nb_Periods]+iATR(NULL,1,18,i);
         TrendUp[i+Nb_Periods] = EMPTY_VALUE;
         if(TrendUp[i+Nb_Periods+1] != EMPTY_VALUE) TrendDown[i+Nb_Periods+1] = TrendUp[i+Nb_Periods+1];
         if (TrendDown[i+Nb_Periods] > TrendDown[i+Nb_Periods+1] && TrendDown[i+Nb_Periods+1] != TrendUp[i+Nb_Periods+1]) TrendDown[i+Nb_Periods] = TrendDown[i+Nb_Periods+1];
         trendIsUp = false;
      }
   }
   // Fill the gap at the end
   if (trendIsUp == true) {
      //Comment("Trend Is Up");
      for (j = Nb_Periods; j > 0; j--) {
         TrendUp[j] = Low[j]-Point*(Digits*2);
         if (TrendUp[j] < TrendUp[j+1]) {TrendUp[j] = TrendUp[j+1];}
      }
   }
   else {
      //Comment("Trend Is Down");
      for (j = Nb_Periods; j > 0; j--) {
         TrendDown[j] = High[j]+Point*(Digits*2);
         if (TrendDown[j] > TrendDown[j+1]) {TrendDown[j] = TrendDown[j+1];}
      }
   }

//----

//----
   return(0);
  }
//+------------------------------------------------------------------+
Comments