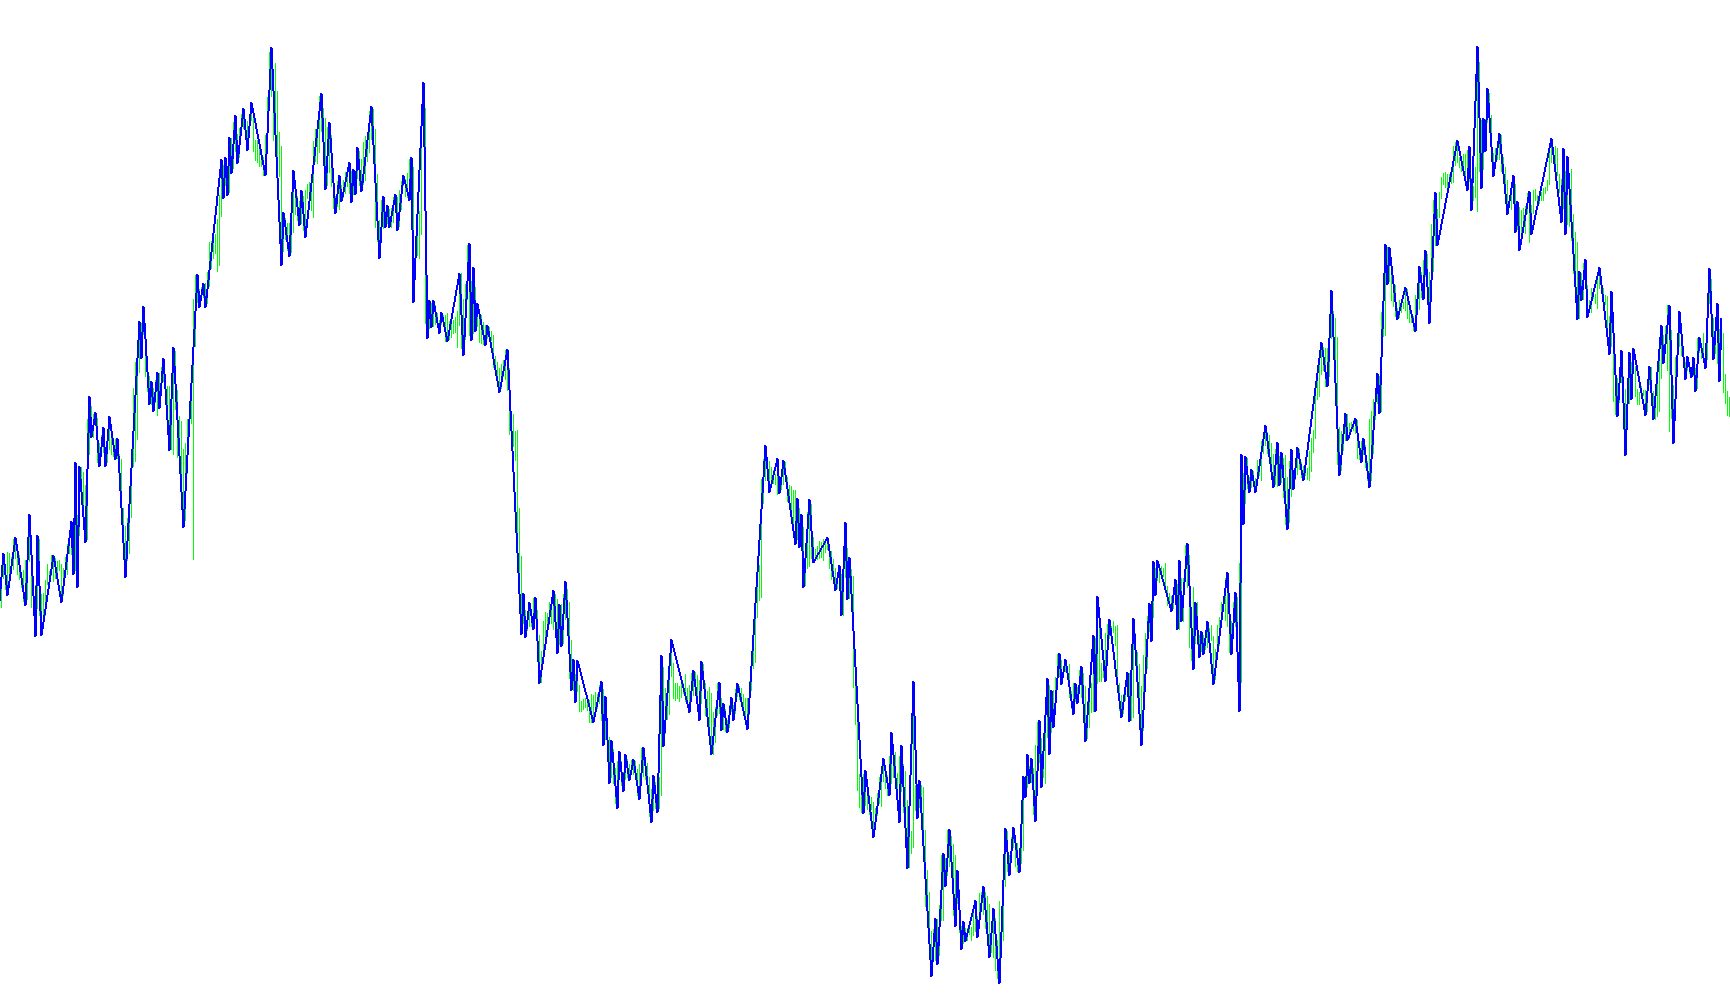
This tool is designed to analyze price movements on a trading chart to identify specific "reversal points" where the market trend might be shifting. Instead of simply looking at every price tick, the logic focuses on tracking the structural highs and lows of the market to pinpoint significant turning points.
How the Logic Works
The script operates by monitoring two primary factors: the prevailing direction of the market (Trend) and the distance between current prices and previous peaks or valleys.
1. Trend Identification and Tracking The tool continuously scans historical data to determine if the market is moving in a specific direction. It establishes "High" and "Low" benchmarks. If the price breaks above a previous high, it recognizes upward movement; if it drops below a previous low, it recognizes downward movement.
2. The Reversal Mechanism The core functionality relies on a user-defined sensitivity parameter (the "ReversPoint"). The script looks for instances where the price moves aggressively against the current trend by a specific distance:
- In an Uptrend: If the price drops significantly below the last established high—specifically more than the set amount of points—the script identifies this as a potential trend exhaustion and signals a reversal to a downward movement.
- In a Downtrend: If the price rises significantly above the last established low—exceeding the set distance—it flags a reversal back to an upward movement.
3. Visual Feedback When these specific conditions are met, the script marks the point on the chart where the trend shifted. By identifying these points of reversal, the tool aims to help traders visualize where momentum has historically changed, making it easier to see where a "top" or "bottom" might have formed based on price action and volatility.
Summary for the User
In simple terms, this script acts as a structural map. It ignores minor fluctuations and only highlights significant "pivot" moments. It tells you: "The price moved far enough in the opposite direction that it is likely the previous trend is over." This allows you to see key transition points on your chart more clearly than by looking at raw price data alone.
//+------------------------------------------------------------------+
//|                                                        RPoint.mq4 |
//|                               Copyright © 2004, Poul_Trade_Forum |
//|                                                         Aborigen |
//|                                          http://forex.kbpauk.ru/ |
//+------------------------------------------------------------------+
#property copyright "Poul Trade Forum"
#property link      "http://forex.kbpauk.ru/"
#property indicator_chart_window
#property indicator_buffers 1
#property indicator_color1 Blue

//---- input parameters
extern int ReversPoint=50;
//---- buffers
double RBuffer[];
int Trend=1,InTrend,ttime;
double Points,Last_High, Last_Low;
//+------------------------------------------------------------------+
//| Custom indicator initialization function                         |
//+------------------------------------------------------------------+
int init()
  {
   string short_name;
   Points = MarketInfo (Symbol(), MODE_POINT);
//---- indicator line
   SetIndexStyle(0,DRAW_SECTION,EMPTY,2,Blue);
   SetIndexBuffer(0,RBuffer);
   SetIndexEmptyValue(0,0);

//---- name for DataWindow and indicator subwindow label
   short_name="RPoint";
   IndicatorShortName(short_name);
   SetIndexLabel(0,short_name);

//----
   SetIndexDrawBegin(0,100);
   ArrayInitialize(RBuffer,0);
//----

   return(0);
  }
//+------------------------------------------------------------------+
//| Custor indicator deinitialization function                       |
//+------------------------------------------------------------------+
int deinit()
  {
//---- TODO: add your code here

//----
   return(0);
  }
//+------------------------------------------------------------------+
//| Custom indicator iteration function                              |
//+------------------------------------------------------------------+
int start()
  {
   int    counted_bars=IndicatorCounted(),i,shift;

//---- TODO: add your code here
i=(Bars-counted_bars)-1;

for (shift=i; shift>=0;shift--)
{

if (Time[shift]!=ttime) InTrend=InTrend+1;
ttime=Time[shift];
RBuffer[shift]=0;
if (High[shift+1]>Last_High && Trend==1)  InTrend=1;
if (Low[shift+1]<Last_Low   && Trend==0)   InTrend=1;
if (High[shift+1]>Last_High) Last_High=High[shift+1];
if (Low[shift+1]<Last_Low)   Last_Low=Low[shift+1];

if (Trend==1 && Low[shift+1]<Last_High-ReversPoint*Points && InTrend>1)
{
Trend=0;
RBuffer[shift+InTrend]=High[shift+InTrend];
Last_High=Low[shift+1];
Last_Low=Low[shift+1];
InTrend=1;
}

if (Trend==0 && High[shift+1]>Last_Low+ReversPoint*Points && InTrend>1)
{
Trend=1;
RBuffer[shift+InTrend]=Low[shift+InTrend];
Last_Low=High[shift+1];
Last_High=High[shift+1];
InTrend=1;
}
//----
}
   return(0);
  }
//+------------------------------------------------------------------+
Comments