t3_ADX_PlusDi_MinusDi_Burst
Download script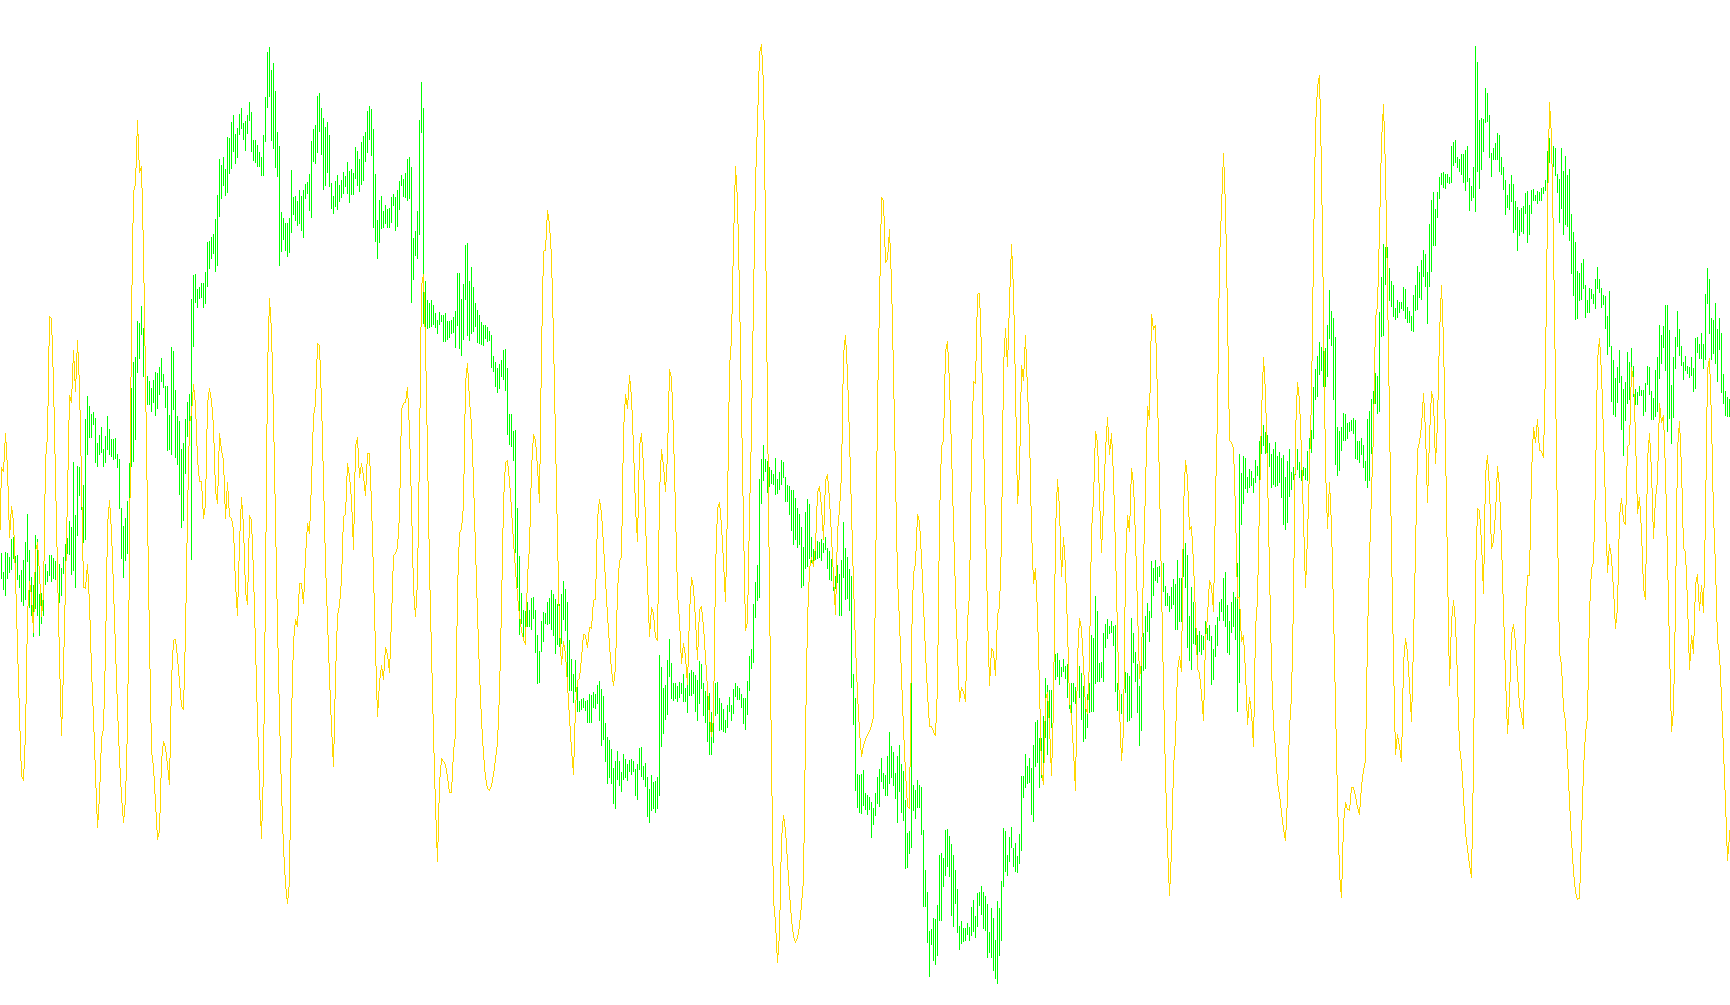
This technical tool is designed to provide traders with a more refined and responsive look at market momentum by analyzing directional strength. Rather than looking at raw price movements alone, the script focuses on the relationship between "Plus" and "Minus" directional indicators, which help distinguish whether the prevailing trend is bullish (upward) or bearish (downward).
Core Logic and Methodology
The script operates using a sophisticated filtering system to smooth out market noise. Here is a breakdown of how it processes data:
1. Directional Component Identification The foundation of this tool relies on two primary components: the Plus DI (which tracks upward pressure) and the Minus DI (which tracks downward pressure). The script specifically isolates these components to see how they are changing from one candle to the next. By calculating the difference between these values, it identifies the immediate "velocity" of the price movement in both directions.
2. Triple Exponential Smoothing (T3) One of the standout features of this logic is the use of a "T3" calculation method. Standard moving averages often suffer from a trade-off: they are either very smooth but slow to react, or very fast but full of "fake-out" signals. The T3 logic acts as a high-performance filter that attempts to solve this. It applies multiple layers of weighted calculations to the data, resulting in a line that stays closer to the actual price action while maintaining a much smoother visual profile than standard indicators.
3. Weighted Weighting and Coefficients The script uses specific mathematical constants (based on a Fibonacci-related ratio) to weight the importance of past data versus current data. This ensures that while the indicator considers historical trends, it remains highly sensitive to recent shifts in momentum. It essentially "calculates the acceleration" of the trend rather than just its speed.
Visual Output and Interpretation
The tool produces two distinct lines on a separate window:
- The Red Line: Represents the processed movement of the "Plus" directional force (bullish momentum).
- The Lime Line: Represents the processed movement of the "Minus" directional force (bearish momentum).
By observing these two lines, a user can see which force is currently dominating the market. Because the logic uses Triple Smoothing, these lines are less likely to "jitter" than standard indicators, allowing for a clearer view of when momentum is actually shifting versus when it is simply experiencing minor fluctuations.
/*-----------------------------+
|			       |
| Shared by www.Aptrafx.com    |
|			       |
+------------------------------*/

//+------------------------------------------------------------------+
//|                                  t3_ADX_PlusDi_MinusDi_Burst.mq4 |
//|                                          Copyright © 2005, F DCG |
//|                                        http://www.metaquotes.net |
//+------------------------------------------------------------------+
#property copyright "Copyright © 2005, F Da Costa Gomez"
#property link      "http://www.metaquotes.net"

#property indicator_separate_window
#property indicator_buffers 2
#property indicator_color1 Red
#property indicator_color2 Lime
//---- input parameters
extern int    t3_period=24;
extern double b=0.618;
extern int ADX_Period=1;

//---- buffers
double ExtMapBuffer1[];
double ExtMapBuffer2[];

//---- Internal variables
double t3, t32;
double plusdi, minusdi;
double b2,b3;
double c1,c2,c3,c4;
double e1,e2,e3,e4,e5,e6;
double M1,M2,n,P1,P2,w1,w2;
double ae1,ae2,ae3,ae4,ae5,ae6;
int shift;

//+------------------------------------------------------------------+
//| Custom indicator initialization function                         |
//+------------------------------------------------------------------+
int init() {
//---- indicators
	IndicatorBuffers(2);

	SetIndexStyle(0,DRAW_LINE);
	SetIndexStyle(1,DRAW_LINE);

	if ( !SetIndexBuffer(0, ExtMapBuffer1) &&
			 !SetIndexBuffer(1, ExtMapBuffer2) ) {
		Print("Cannot create indicator buffers");
	}

//----- variables
  b2=b*b;
	b3=b2*b;
	c1=-b3;
	c2=(3*(b2+b3));
	c3=-3*(2*b2+b+b3);
	c4=(1+3*b+b3+3*b2);
	n=t3_period;

	if (n<1) n=1;
	n = 1 + 0.5*(n-1);
	w1 = 2 / (n + 1);
	w2 = 1 - w1;

	return(0);
 }

//+------------------------------------------------------------------+
//| Custom indicator deinitialization function                       |
//+------------------------------------------------------------------+
int deinit() {
//----
//----
	return;
}

//+------------------------------------------------------------------+
//| Custom indicator iteration function                              |
//+------------------------------------------------------------------+
int start() {
	int limit;
  int counted_bars=IndicatorCounted();
  if (counted_bars<0) return(-1);

  if (counted_bars==0) {
  	// 2b used for 1st round processing
  }

  if (counted_bars > 0) counted_bars--;
  else counted_bars=1;

  limit = Bars - counted_bars;


	for (shift=limit; shift>=0; shift--) {
		P1=iADX(NULL, 0, ADX_Period, PRICE_CLOSE, MODE_PLUSDI, shift);
		P2=iADX(NULL, 0, ADX_Period, PRICE_CLOSE, MODE_PLUSDI, shift+1);
		plusdi= P1-P2;

		e1 = w1*plusdi + w2*e1;
		e2 = w1*e1 + w2*e2;
		e3 = w1*e2 + w2*e3;
		e4 = w1*e3 + w2*e4;
		e5 = w1*e4 + w2*e5;
		e6 = w1*e5 + w2*e6;

		t3 = c1*e6 + c2*e5 + c3*e4 + c4*e3;
		ExtMapBuffer1[shift]=t3;

		M1=iADX(NULL, 0, ADX_Period,PRICE_CLOSE,MODE_MINUSDI,shift);
		M2=iADX(NULL, 0, ADX_Period,PRICE_CLOSE,MODE_MINUSDI,shift+1);
		minusdi= M1-M2;

		ae1 = w1*minusdi + w2*ae1;
		ae2 = w1*ae1 + w2*ae2;
		ae3 = w1*ae2 + w2*ae3;
		ae4 = w1*ae3 + w2*ae4;
		ae5 = w1*ae4 + w2*ae5;
		ae6 = w1*ae5 + w2*ae6;

		t32 = c1*ae6 + c2*ae5 + c3*ae4 + c4*ae3;
		ExtMapBuffer2[shift]=t32;
	}

//----
   return;
}
//+------------------------------------------------------------------+
Comments