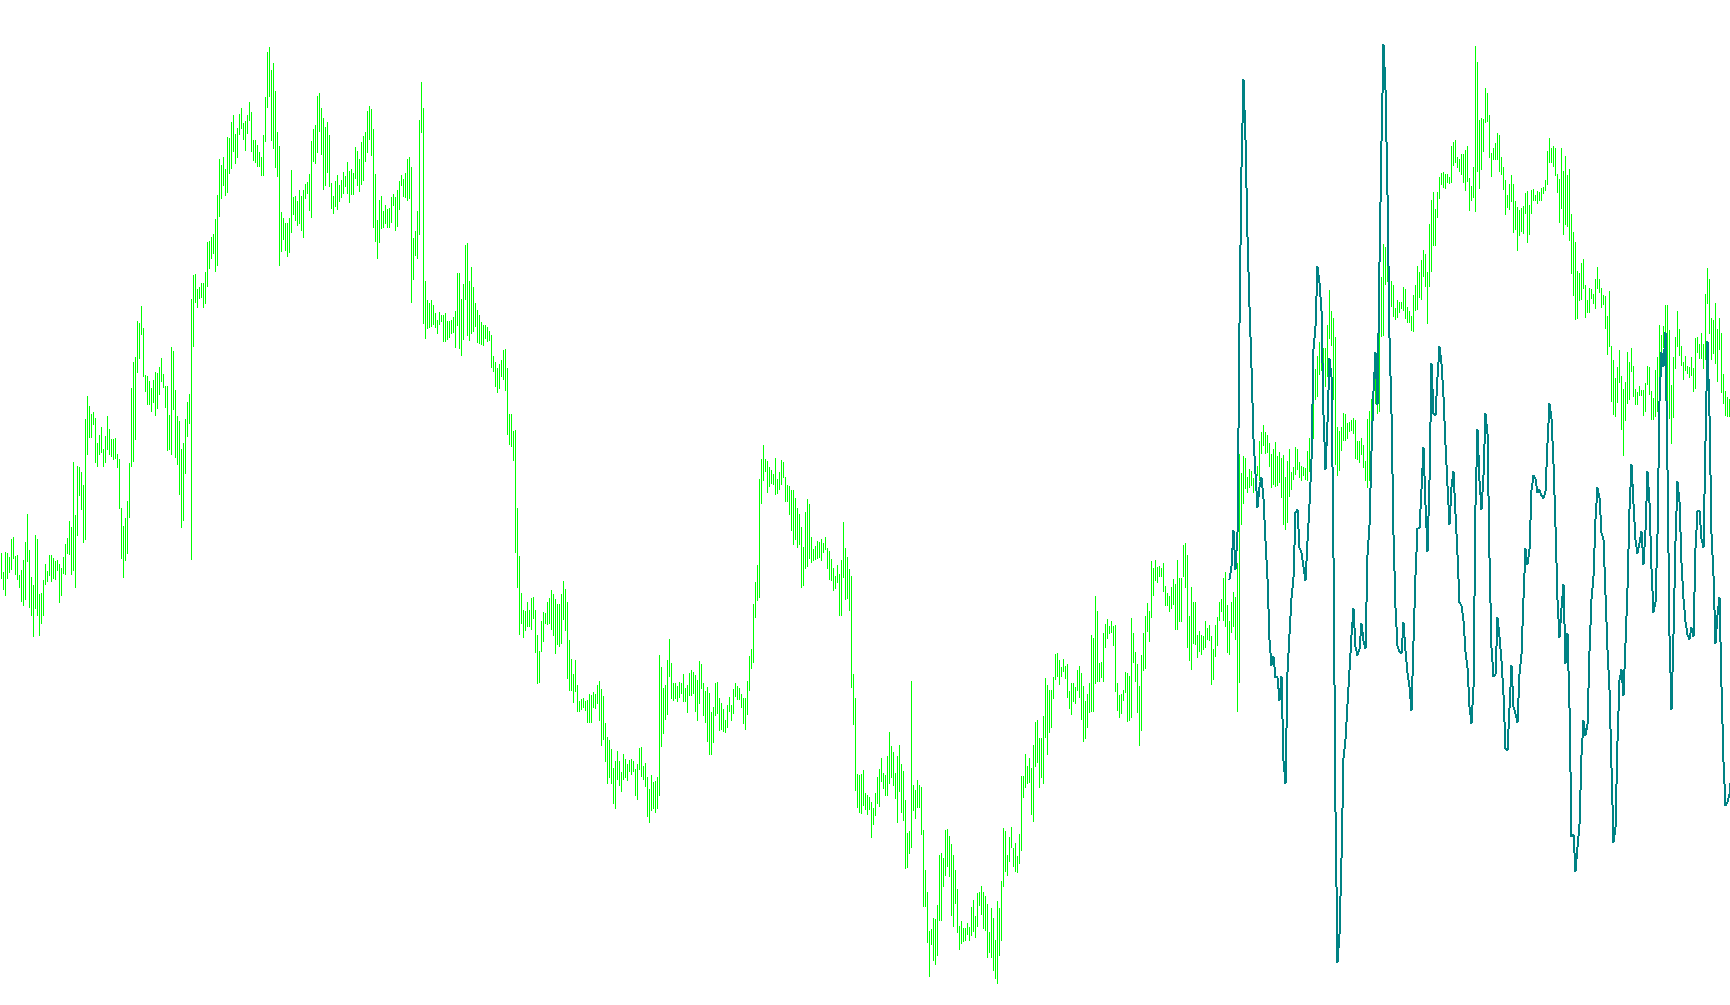
This tool is designed to provide a visual representation of price momentum, specifically engineered to help traders identify the strength and direction of market trends. By analyzing price movements over time, it filters out "noise" to show the underlying velocity of the market.
Core Logic and Methodology
The script operates by calculating two distinct mathematical paths based on historical closing prices:
1. Triple Exponential Smoothing (T3) Instead of using a standard moving average—which can often lag behind current price action—this script utilizes a sophisticated "Triple Exponential" calculation. This method applies a smoothing filter multiple times to the price data. The result is a curve that reacts more quickly to recent price changes while remaining significantly smoother than a basic average.
2. Dual-Layer Momentum Comparison The indicator processes two different versions of this smoothed data simultaneously:
- One version uses a short-term window (controlled by the
EMA_period). - The second version uses a longer-term window (controlled by the
MomPeriod).
By comparing these two distinct smoothing layers, the script determines the "Momentum" of the asset. It essentially asks: How much faster is the short-term trend moving compared to the long-term trend?
Data Visualization
The final output is displayed as a single line in a separate window below the main price chart. The logic converts the difference between the two smoothing layers into a percentage format:
- Positive Values: Indicate that the short-term momentum is accelerating faster than the long-term trend, suggesting upward strength.
- Negative Values: Indicate that the short-term momentum is lagging or dropping below the long-term trend, suggesting downward pressure.
- Magnitude: The distance of the line from the zero mark shows the intensity of the movement; the further the line moves away from zero, the stronger the prevailing momentum.
Summary for Traders
In plain terms, this script acts as a "speedometer" for the market. Rather than just showing you where the price is, it helps you see how fast and in what direction the price is moving by comparing high-frequency data against low-frequency trends. This allows for a clearer perspective on whether a trend is gaining steam or beginning to exhaust itself.
/*-----------------------------+
|			       |
| Shared by www.Aptrafx.com    |
|			       |
+------------------------------*/

//+------------------------------------------------------------------+
//|                                                 T3_iAnchMom.mq4  |
//|                                       Ramdass - Conversion only  |
//+------------------------------------------------------------------+


#property indicator_separate_window
#property indicator_buffers 1
#property indicator_color1 Teal

//---- input parameters
extern int EMA_period=3;
extern int MomPeriod=8;

extern int CountBars=300;
//---- buffers
double MomBuffer[];
double e1,e2,e3,e4,e5,e6,e7,e8,e9,e10,e11,e12;
double c1,c2,c3,c4;
double n,n1,w1,w2,b2,b3,w3,w4,b;
//+------------------------------------------------------------------+
//| Custom indicator initialization function                         |
//+------------------------------------------------------------------+
int init()
  {
//   string short_name;
//---- indicator line
   IndicatorBuffers(1);
   SetIndexBuffer(0, MomBuffer);
   SetIndexStyle(0,DRAW_LINE,STYLE_SOLID,2,Teal);
//   SetIndexDrawBegin(0,Bars-CountBars+(MomPeriod*2)*EMA_period);
//---- name for DataWindow and indicator subwindow label
//   short_name="iAnchMom("+MomPeriod+")";
//   IndicatorShortName(short_name);
//   SetIndexLabel(0,short_name);
//----
//----
//---- variable reset
/*e1=0; e2=0; e3=0; e4=0; e5=0; e6=0;
c1=0; c2=0; c3=0; c4=0;
n=0;n1=0;
w1=0; w2=0; w3=0; w4=0;
b2=0; b3=0;*/

b = 0.7;
b2=b*b;
b3=b2*b;
c1=-b3;
c2=(3*(b2+b3));
c3=-3*(2*b2+b+b3);
c4=(1+3*b+b3+3*b2);
n=EMA_period;
n1=MomPeriod + MomPeriod + 1;

if (n<1) n=1;
n = 1 + 0.5*(n-1);
w1 = 2 / (n + 1);
w2 = 1 - w1;
if (n1<1) n1=1;
n1 = 1 + 0.5*(n1-1);
w3 = 2 / (n1 + 1);
w4 = 1 - w3;
   return(0);
  }
//+------------------------------------------------------------------+
//| T3_iAnchMom                                                      |
//+------------------------------------------------------------------+
int start()
  {
   SetIndexDrawBegin(0,Bars-CountBars+(MomPeriod*2)*EMA_period);
   int i,counted_bars=IndicatorCounted();
   double a,c;
//   int SMA_Period = MomPeriod + MomPeriod + 1;

   if(Bars<=n1) return(0);

//---- initial zero
   if(counted_bars<n1)
      for(i=1;i<=n1;i++) MomBuffer[Bars-i]=0.0;
//----
   i=CountBars-1;
   if(counted_bars>=1) i=CountBars-counted_bars-1;
   while(i>=0)
     {

e1 = w1*Close[i] + w2*e1;
e2 = w1*e1 + w2*e2;
e3 = w1*e2 + w2*e3;
e4 = w1*e3 + w2*e4;
e5 = w1*e4 + w2*e5;
e6 = w1*e5 + w2*e6;

a=c1*e6 + c2*e5 + c3*e4 + c4*e3;

e7 = w3*Close[i] + w4*e7;
e8 = w3*e7 + w4*e8;
e9 = w3*e8 + w4*e9;
e10 = w3*e9 + w4*e10;
e11 = w3*e10 + w4*e11;
e12 = w3*e11 + w4*e12;

c=c1*e12 + c2*e11 + c3*e10 + c4*e9;

      //a = iMA(NULL,0,EMA_period,0, MODE_EMA,PRICE_CLOSE, i);
      //b = iMA(NULL,0,SMA_Period,0, MODE_SMA, PRICE_CLOSE, i);
      MomBuffer[i]= 100*((a / c)-1);


      i--;
     }
   return(0);
  }
//+------------------------------------------------------------------+
Comments