T3_iAnchMom2
Download script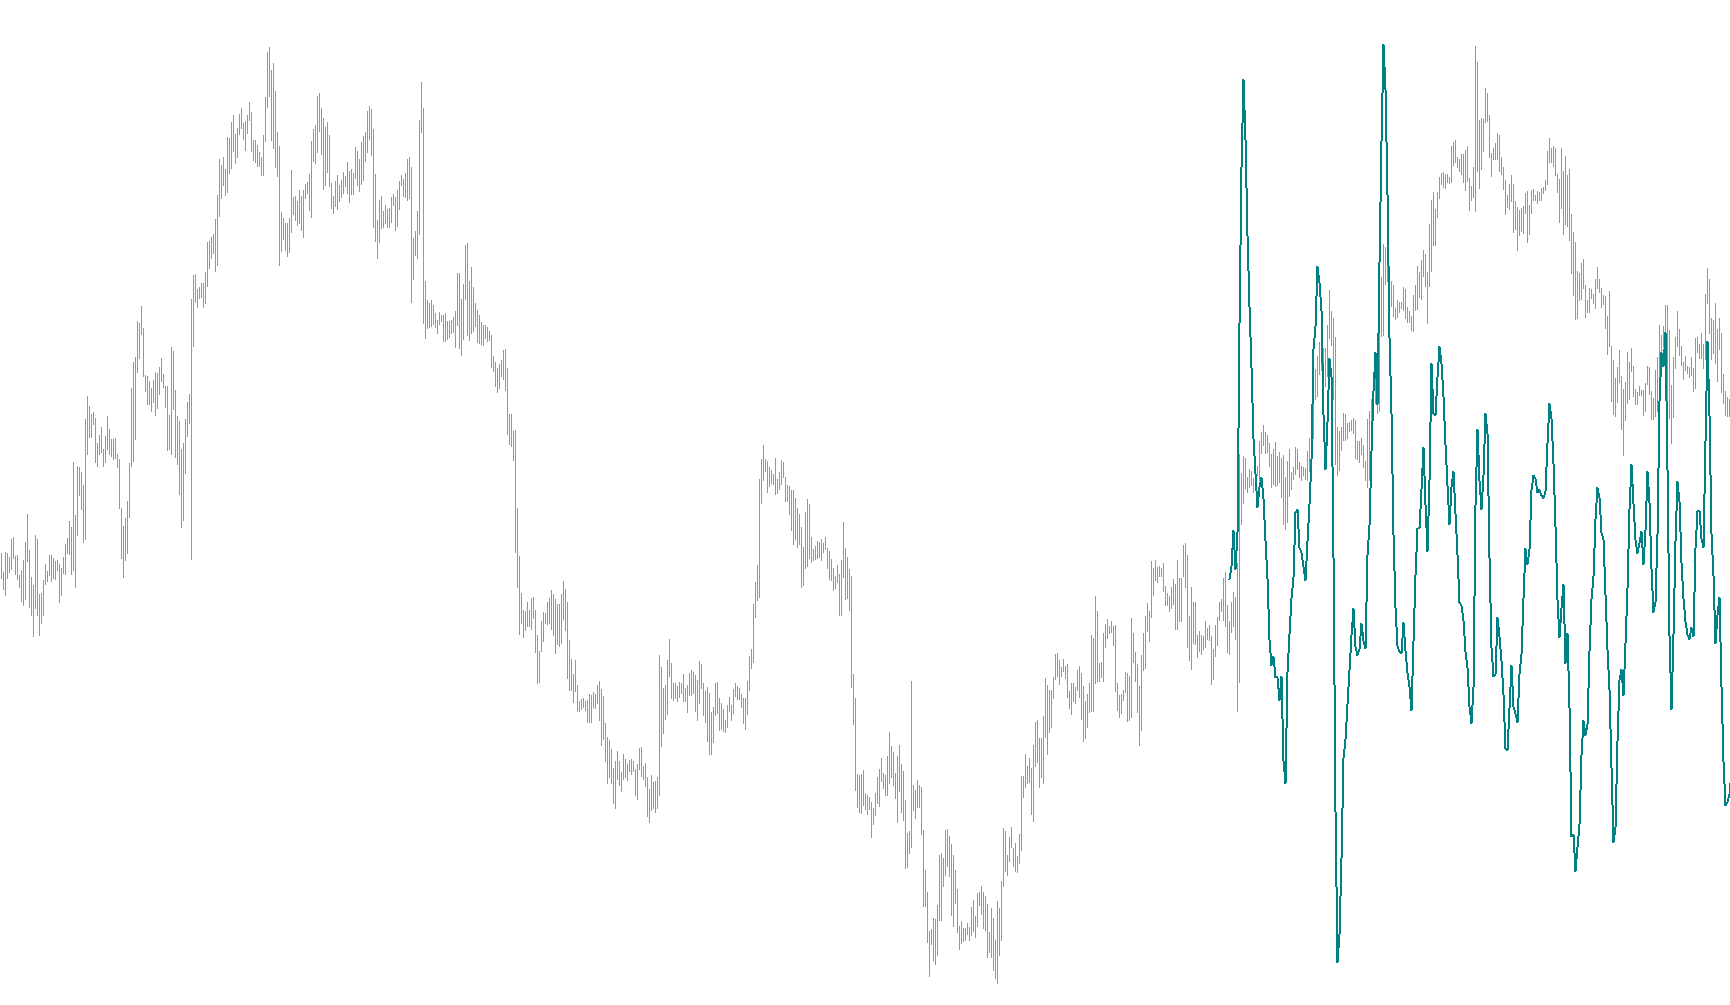
This custom technical indicator is designed to provide a visual representation of price momentum by analyzing the relationship between different smoothed price averages. Instead of simply looking at the raw price, it uses a sophisticated mathematical approach to filter out market noise and highlight the underlying strength or weakness of a trend.
Core Logic and Methodology
The script operates by calculating two distinct types of price smoothing and then comparing them against one another:
1. Advanced Smoothing Layers The indicator utilizes a multi-layered smoothing technique. It takes the closing prices of the market and passes them through a series of successive calculations (weighted averages). By layering these calculations, the tool ensures that the resulting data is "smoother" than a standard moving average, which helps in identifying long-term trends without being distracted by minor, temporary price fluctuations.
2. Relative Momentum Calculation The primary goal of the script is to measure the percentage difference between two different smoothing results:
- One set of calculations focuses on a fast-reacting smoothed average (governed by the
EMA_period). - The second set focuses on a slower, more stabilized smoothed average (governed by the
MomPeriod).
By comparing these two values, the indicator determines how much faster or slower one trend is moving relative to the other. This "momentum" represents the speed at which the market is currently trending.
3. Percentage Output Rather than displaying a raw price point, the final result is converted into a percentage value. The logic subtracts the base value from the primary smoothed value and multiplies it by 100. This allows traders to see momentum as a relative figure; for example, if the line is moving upward, it indicates increasing bullish strength, while a downward movement signals weakening momentum or a shift toward a bearish trend.
How it Appears on the Chart
The result is displayed in a separate window below the main price chart as a continuous teal line. By observing this line, users can quickly gauge whether the market's current direction is accelerating, slowing down, or losing steam, providing a clearer picture of market dynamics than price action alone might reveal.
//+------------------------------------------------------------------+
//|                                                 T3_iAnchMom.mq4  |
//|                                       Ramdass - Conversion only  |
//+------------------------------------------------------------------+


#property indicator_separate_window
#property indicator_buffers 1
#property indicator_color1 Teal

//---- input parameters
extern int EMA_period=3;
extern int MomPeriod=8;

extern int CountBars=300;
//---- buffers
double MomBuffer[];
double e1,e2,e3,e4,e5,e6,e7,e8,e9,e10,e11,e12;
double c1,c2,c3,c4;
double n,n1,w1,w2,b2,b3,w3,w4,b;
//+------------------------------------------------------------------+
//| Custom indicator initialization function                         |
//+------------------------------------------------------------------+
int init()
  {
//---- indicator line
   IndicatorBuffers(1);
   SetIndexBuffer(0, MomBuffer);
   SetIndexStyle(0,DRAW_LINE,STYLE_SOLID,2,Teal);
//---- variable reset
/*e1=0; e2=0; e3=0; e4=0; e5=0; e6=0;
c1=0; c2=0; c3=0; c4=0;
n=0;n1=0;
w1=0; w2=0; w3=0; w4=0;
b2=0; b3=0;*/

b = 0.7;
b2=b*b;
b3=b2*b;
c1=-b3;
c2=(3*(b2+b3));
c3=-3*(2*b2+b+b3);
c4=(1+3*b+b3+3*b2);
n=EMA_period;
n1=MomPeriod + MomPeriod + 1;

if (n<1) n=1;
n = 1 + 0.5*(n-1);
w1 = 2 / (n + 1);
w2 = 1 - w1;
if (n1<1) n1=1;
n1 = 1 + 0.5*(n1-1);
w3 = 2 / (n1 + 1);
w4 = 1 - w3;
   return(0);
  }
//+------------------------------------------------------------------+
//| T3_iAnchMom                                                      |
//+------------------------------------------------------------------+
int start()
  {
   if (CountBars>Bars) CountBars=Bars;
   SetIndexDrawBegin(0,Bars-CountBars+(MomPeriod*2)*EMA_period);
   int i,counted_bars=IndicatorCounted();
   double a,c;
//   int SMA_Period = MomPeriod + MomPeriod + 1;

   if(Bars<=n1) return(0);

//---- initial zero
   if(counted_bars<n1)
      for(i=1;i<=n1;i++) MomBuffer[Bars-i]=0.0;
//----
   i=CountBars-1;
//   if(counted_bars>=1) i=Bars-counted_bars-1;
   while(i>=0)
     {

e1 = w1*Close[i] + w2*e1;
e2 = w1*e1 + w2*e2;
e3 = w1*e2 + w2*e3;
e4 = w1*e3 + w2*e4;
e5 = w1*e4 + w2*e5;
e6 = w1*e5 + w2*e6;

a=c1*e6 + c2*e5 + c3*e4 + c4*e3;

e7 = w3*Close[i] + w4*e7;
e8 = w3*e7 + w4*e8;
e9 = w3*e8 + w4*e9;
e10 = w3*e9 + w4*e10;
e11 = w3*e10 + w4*e11;
e12 = w3*e11 + w4*e12;

c=c1*e12 + c2*e11 + c3*e10 + c4*e9;

      //a = iMA(NULL,0,EMA_period,0, MODE_EMA,PRICE_CLOSE, i);
      //b = iMA(NULL,0,SMA_Period,0, MODE_SMA, PRICE_CLOSE, i);
      MomBuffer[i]= 100*((a / c)-1);


      i--;
     }
   return(0);
  }
//+------------------------------------------------------------------+
Comments