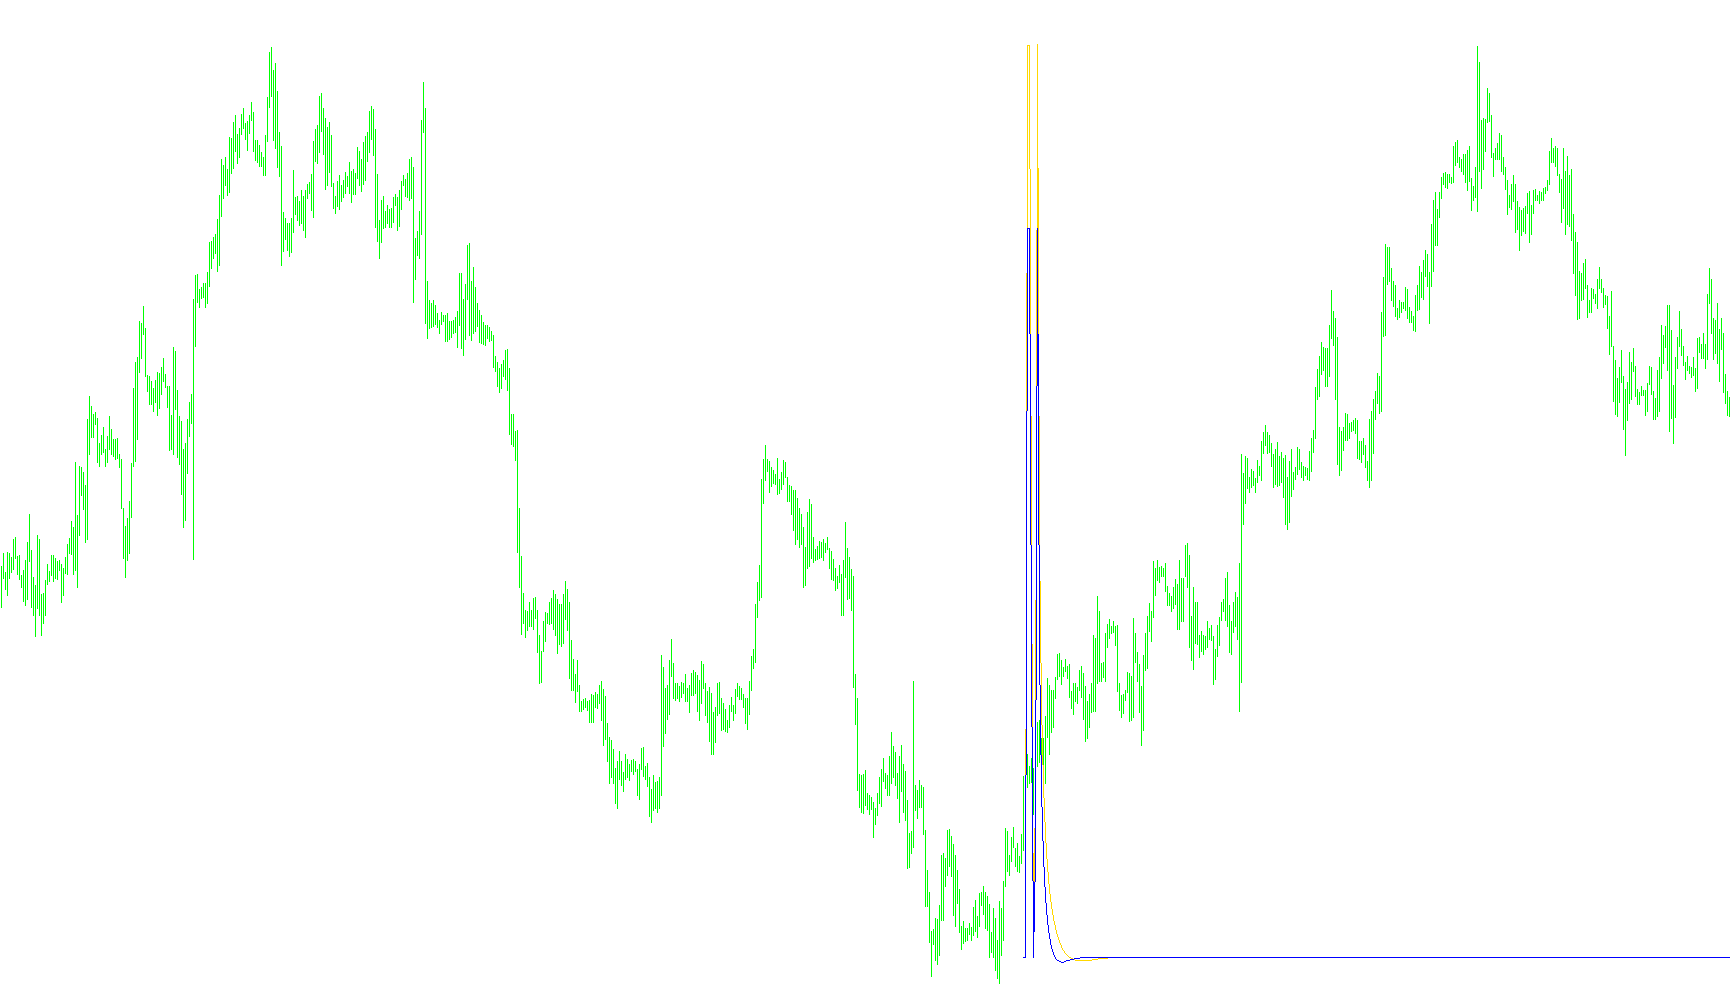
Functional Overview: T3 TRIX Indicator
This script is a sophisticated technical analysis tool designed to smooth out market price movements and calculate specific velocity trends. It focuses on identifying momentum by analyzing how prices change over different timeframes, providing a clearer picture of market direction than standard price action alone.
Core Logic & Methodology
The indicator operates using a multi-layered mathematical approach called the T3 Moving Average logic combined with Rate of Change (ROC) calculations. Here is the step-by-step breakdown of how it processes data:
- Double Smoothing Layer: Instead of simply averaging prices, the script applies a proprietary smoothing technique (the T3 method). This involves running the price data through several internal calculation cycles. This reduces "noise" and lag, allowing the indicator to remain responsive to new information while filtering out minor, insignificant fluctuations.
- Two Distinct Data Streams: The tool simultaneously calculates two independent trends:
- Trend A: Based on a primary user-defined period (e.g., 18 bars).
- Trend B: Based on a secondary, different period (e.g., 10 bars).
- Velocity Calculation (Rate of Change): Once the two trends are smoothed, the script calculates the rate of change. Rather than showing you the price level, it shows you the percentage of growth or decline between the current trend value and its previous value.
- Comparative Dynamics: By comparing these two different periods of time, the tool helps traders identify if a long-term trend is accelerating, decelerating, or being influenced by short-term volatility.
Visual Output
The indicator produces two distinct lines on a separate window below your main price chart:
- Primary Line (DeepSkyBlue): Represents the percentage change of the primary smoothing period. It shows you the "speed" of the main market move.
- Secondary Line (Blue): Depending on your settings, this either represents the percentage change of the second smoothing period or a combined value of both.
Key Parameters and Behavior
- Sensitivity: Users can adjust the periods for both Trend A and Trend B to look at different "magnifications" of the market.
- Price Source: The script allows you to choose whether it should calculate based on the Close price (the price at which a candle finishes) or the Open price (the starting price of a candle).
- Dynamic Calculation: The logic is designed to be "self-correcting" as new data arrives, ensuring that the calculated trends update in real-time with every new price tick.
Summary for the User
In simple terms, this script acts like a speedometer for market trends. While a normal moving average tells you how fast the car is going, this indicator tells you if the driver is hitting the gas pedal or the brakes by comparing different speeds across two different time scales simultaneously. It helps in identifying where momentum is shifting before it becomes obvious on the standard price chart.
//+------------------------------------------------------------------+
//|                                          T3 TRIX (ROC of T6).mq4 |
//|                      convert FinGeR Alex orginal by Luis Damiani |
//|                                                                  |
//+------------------------------------------------------------------+
#property copyright "convert FinGeR Alex orginal by Luis Damiani"
#property link      ""

#property indicator_separate_window
#property indicator_buffers 2
#property indicator_color1 DeepSkyBlue
#property indicator_color2 Blue
//---- input parameters
extern int       A_t3_period=18;
extern int       num_bars=350;
extern int       is_A_open_price=0;
extern int       B_t3_period_ac=10;
extern int       diferential=0;
extern double    hot=0.7;
//---- buffers
double ExtMapBuffer1[];
double ExtMapBuffer2[];
//+------------------------------------------------------------------+
//| Custom indicator initialization function                         |
//+------------------------------------------------------------------+
int init()
  {
//---- indicators
   SetIndexStyle(0,DRAW_LINE);
   SetIndexBuffer(0,ExtMapBuffer1);
   SetIndexStyle(1,DRAW_LINE);
   SetIndexBuffer(1,ExtMapBuffer2);
//----
   return(0);
  }
//+------------------------------------------------------------------+
//| Custor indicator deinitialization function                       |
//+------------------------------------------------------------------+
int deinit()
  {
//----

//----
   return(0);
  }
//+------------------------------------------------------------------+
//| Custom indicator iteration function                              |
//+------------------------------------------------------------------+
int start()
  {

int  shift=0;
double A_t3=0,A_t3_1=0,max_per=0;
double  B_t3=0,B_t3_1=0;
double e1=0,e2=0,e3=0,e4=0,e5=0,e6=0,c1=0,c2=0,c3=0,c4=0;
double e1x=0,e2x=0,e3x=0,e4x=0,e5x=0,e6x=0;
double d1=0,d2=0,d3=0,d4=0,d5=0,d6=0;
double d1x=0,d2x=0,d3x=0,d4x=0,d5x=0,d6x=0;
double n=0,A_w1=0,A_w2=0,B_w1=0,B_w2=0,b2=0,b3=0;
double init=true;
double bar=0, prevbars=0, start=0, cs=0, prevcs=0,frame=0;
string commodt="nonono";
int    counted_bars=IndicatorCounted();

cs = num_bars+A_t3_period+is_A_open_price+B_t3_period_ac+diferential+hot;

if (cs==prevcs && commodt==Symbol() && frame==Time[4]-Time[5] && Bars-prevbars<2)
start=Bars-prevbars;
else start=-1;
commodt=Symbol();
frame=Time[4]-Time[5];
prevbars = Bars;
prevcs = cs;

if (start==1 || start==0)  bar=start; else init=true;

if (init==true)
{
  b2=hot*hot;
  b3=b2*hot;
  c1=-b3;
  c2=(3*(b2+b3));
  c3=-3*(2*b2+hot+b3);
  c4=(1+3*hot+b3+3*b2);

  n=A_t3_period;

  if (n<1) n=1;

  n = 1 + 0.5*(n-1);
  A_w1 = 2 / (n + 1);
  A_w2 = 1 - A_w1;

 n=B_t3_period_ac;

  if (n<1) n=1;
  n = 1 + 0.5*(n-1);
  B_w1 = 2 / (n + 1);
  B_w2 = 1 - B_w1;

ExtMapBuffer1[num_bars-1]=0;


e1x=0;e2x=0;e3x=0;e4x=0;e5x=0;e6x=0;

ExtMapBuffer2[num_bars-1]=0;

d1x=0;d2x=0;d3x=0;d4x=0;d5x=0;d6x=0;

// max_per=max(A_t3_period,B_t3_period_ac);
bar=num_bars-2;
init=false;
}


//SetLoopCount(0);
shift=bar;

while(shift>=0)

{

 if ( is_A_open_price==1 ) d1 = A_w1*Open[shift] + A_w2*d1x;
  else d1 = A_w1*Close[shift] + A_w2*d1x;
  d2 = A_w1*d1 + A_w2*d2x;
  d3 = A_w1*d2 + A_w2*d3x;
  d4 = A_w1*d3 + A_w2*d4x;
  d5 = A_w1*d4 + A_w2*d5x;
  d6 = A_w1*d5 + A_w2*d6x;

  A_t3 = c1*d6 + c2*d5 + c3*d4 + c4*d3;


if ((start==1 && shift==1) || start==-1  )
{

  d1x=d1;
  d2x=d2;
  d3x=d3;
  d4x=d4;
  d5x=d5;
  d6x=d6;
  }
  e1 = B_w1*Close[shift] + B_w2*e1x;
  e2 = B_w1*e1 + B_w2*e2x;
  e3 = B_w1*e2 + B_w2*e3x;
  e4 = B_w1*e3 + B_w2*e4x;
  e5 = B_w1*e4 + B_w2*e5x;
  e6 = B_w1*e5 + B_w2*e6x;
B_t3 = c1*e6 + c2*e5 + c3*e4 + c4*e3;

  if(diferential==1)
  {

   ExtMapBuffer1[shift]=(A_t3-A_t3_1)/A_t3_1;
   ExtMapBuffer2[shift]=(A_t3-A_t3_1)/A_t3_1+(B_t3-B_t3_1)/B_t3_1;


  }
  else
  {

if ( B_t3_1 >0 && A_t3_1>0) {
ExtMapBuffer2[shift]=(B_t3-B_t3_1)/B_t3_1;
ExtMapBuffer1[shift]=(A_t3-A_t3_1)/A_t3_1;
}
  //Comment("0");

  }

 //Comment("  start: ",start,"  bar: ",bar,"\n",
//"frame: ",frame,"  num_bars:" ,num_bars," commodity: ",commodt ,"\n",(B_t3-B_t3_1)/B_t3_1);

if ((start==1 && shift==1) || start==-1)
{
//Comment("Bar=ghfghfgh");
  A_t3_1=A_t3;
  B_t3_1=B_t3;
  e1x=e1;
  e2x=e2;
  e3x=e3;
  e4x=e4;
  e5x=e5;
  e6x=e6;

 }

  shift--;
//Comment("View !!!  NO?????");
   }
//----


  }
//+------------------------------------------------------------------+
Comments