T3_TRIX_exit_v1
Download script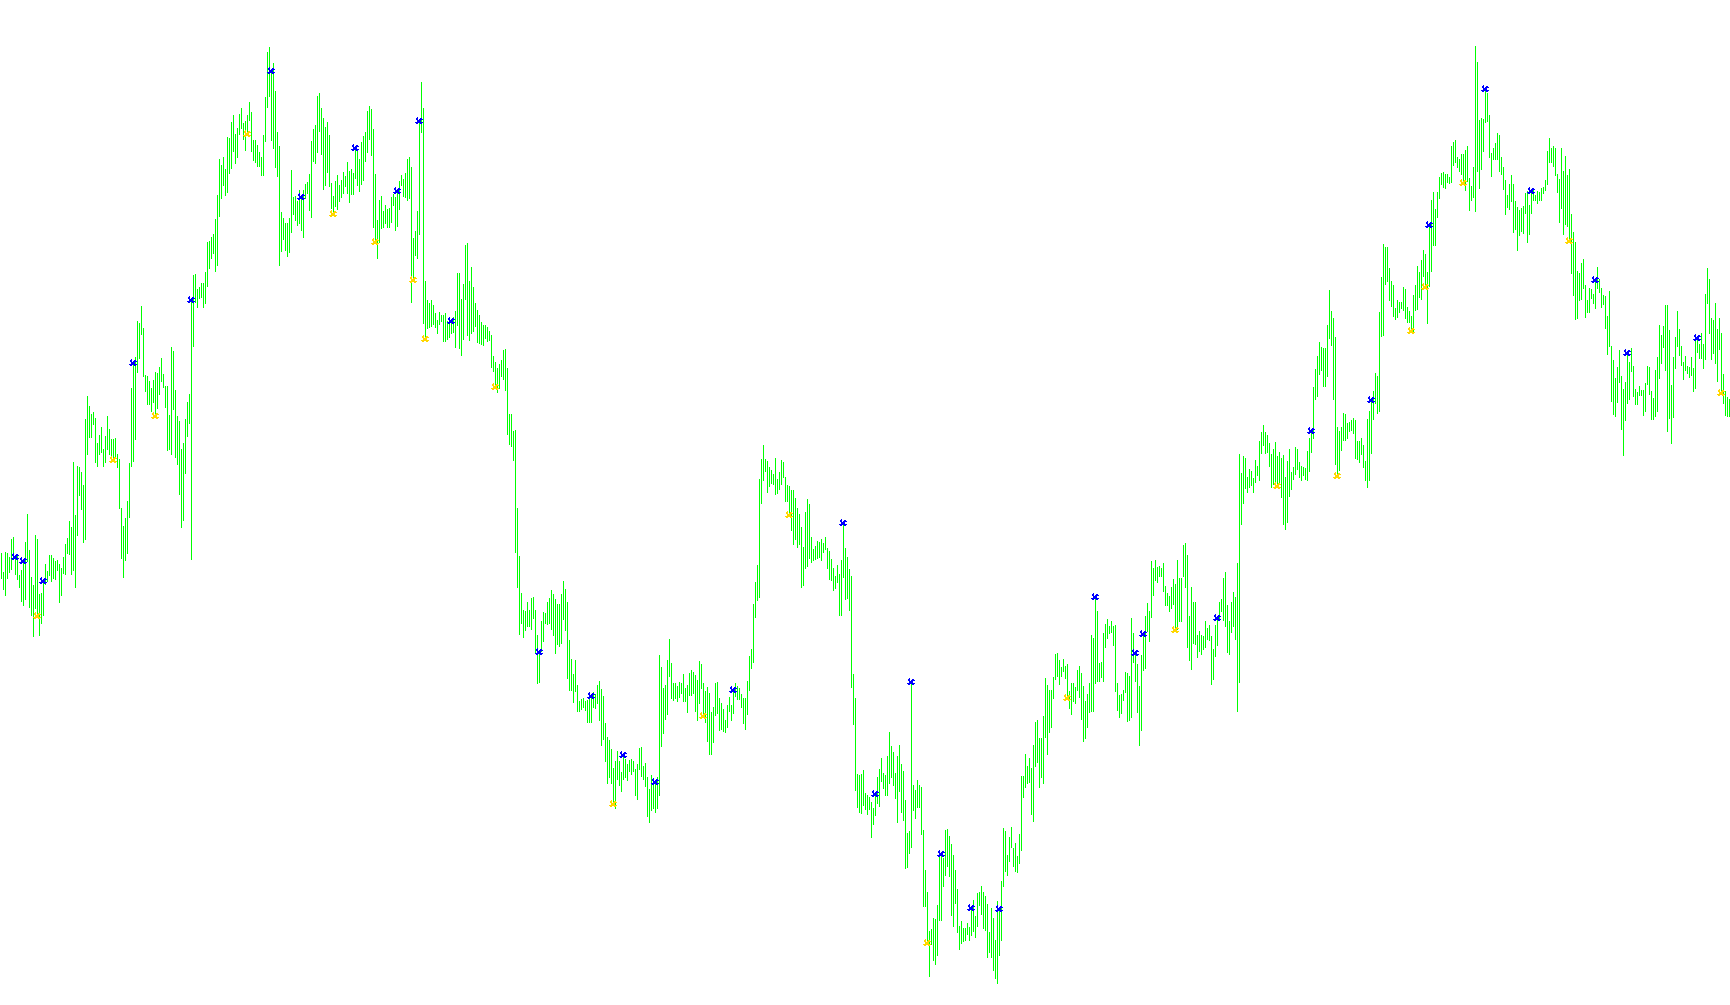
This script is a specialized technical analysis tool designed to identify specific price action signals on a trading chart. Its primary purpose is to act as an "exit" assistant, helping traders determine potential points where a trend might be losing momentum or reversing.
Core Logic and Functionality
The tool operates by analyzing a secondary mathematical calculation known as the T3 TRIX. Instead of looking at raw price movements alone, it evaluates the fluctuations of this specific indicator to spot subtle shifts in market sentiment.
Here is how the logic processes information:
- Momentum Tracking: The script looks at the values of the T3 TRIX across three consecutive historical data points. By comparing these points, it identifies "peaks" and "valleys" in the momentum rather than just looking at whether the price is going up or down.
- Identifying Bearish Signals (Potential Sell/Exit): The script monitors for a specific downward curve in the indicator's movement. When it detects that the current value is lower than the previous one, but the previous one was higher than the one before it, it identifies a potential exhaustion of upward strength. When this condition is met, the tool marks a signal at the bottom of the price candle.
- Identifying Bullish Signals (Potential Buy/Exit): Conversely, the script monitors for an upward curve. If the indicator shows a value that is higher than the one preceding it, but lower than the one before that, it suggests a potential exhaustion of downward pressure. When this occurs, the tool marks a signal at the top of the price candle.
Visual Representation
The script simplifies these complex calculations into easy-to-read visual markers on your trading platform:
- Blue Arrows/Markers: These appear when the logic detects a potential bearish shift (a point where you might consider exiting a long position or considering a sell).
- Red Arrows/Markers: These appear when the logic detects a potential bullish shift (a point where you might consider exiting a short position or considering a buy).
Summary for the User
Think of this script as an early warning system. It doesn't tell you exactly what to do, but it filters through thousands of data points in the T3 TRIX indicator to highlight specific moments where the market's "push" is starting to weaken. By highlighting these pivot points on your chart, it allows for more disciplined decision-making regarding when to take profits or exit a trade.
//+------------------------------------------------------------------+
//|                                                 T3_TRIX_exit.mq4 |
//|                               main idea kalenzo, simone@konto.pl |
//|                                                      modify hada |
//+------------------------------------------------------------------+
#property copyright "Kalenzo"
#property link      "http://www.forex-tsd.com"
#property indicator_buffers 2
#property indicator_color1 Blue
#property indicator_color2 Red
extern int       A_t3_period=50;
extern int       num_bars=1500;
extern int       is_A_open_price=0;
extern int       B_t3_period_ac=34;
extern int       diferential=0;
extern double    hot=0.5;
double exitL[],exitS[];

#property indicator_chart_window
//+------------------------------------------------------------------+
//| Custom indicator initialization function                         |
//+------------------------------------------------------------------+
int init()
  {
//---- indicators
   SetIndexStyle(0,DRAW_ARROW,EMPTY,1);
   SetIndexStyle(1,DRAW_ARROW,EMPTY,1);

   SetIndexBuffer(0,exitL);
   SetIndexBuffer(1,exitS);
//----
   return(0);
  }
//+------------------------------------------------------------------+
//| Custom indicator deinitialization function                       |
//+------------------------------------------------------------------+
int deinit()
  {
//----

//----
   return(0);
  }
//+------------------------------------------------------------------+
//| Custom indicator iteration function                              |
//+------------------------------------------------------------------+
int start()
  {
   int limit;
   int counted_bars=IndicatorCounted();
   if(counted_bars<0) counted_bars=0;
   if(counted_bars>0) counted_bars--;
   limit=Bars-counted_bars;
//----
   for(int i = 0 ;i < limit ;i++)
   {
      double f1u = iCustom(Symbol(),0,"T3 TRIX",A_t3_period,num_bars,is_A_open_price,B_t3_period_ac,diferential,hot,0,i);
      double f2u = iCustom(Symbol(),0,"T3 TRIX",A_t3_period,num_bars,is_A_open_price,B_t3_period_ac,diferential,hot,0,i+1);
      double f3u = iCustom(Symbol(),0,"T3 TRIX",A_t3_period,num_bars,is_A_open_price,B_t3_period_ac,diferential,hot,0,i+2);

      double f1d = iCustom(Symbol(),0,"T3 TRIX",A_t3_period,num_bars,is_A_open_price,B_t3_period_ac,diferential,hot,1,i);
      double f2d = iCustom(Symbol(),0,"T3 TRIX",A_t3_period,num_bars,is_A_open_price,B_t3_period_ac,diferential,hot,1,i+1);
      double f3d = iCustom(Symbol(),0,"T3 TRIX",A_t3_period,num_bars,is_A_open_price,B_t3_period_ac,diferential,hot,1,i+2);

      if(f1u < f2u && f2u > f3u)
      {
         exitL[i] = Low[i];
         exitS[i] = 0.0;
      }
      else if(f1d > f2d && f2d < f3d)
      {
        exitS[i] = High[i];
        exitL[i] = 0.0;
      }
   }
//----
   return(0);
  }
//+------------------------------------------------------------------+
Comments