T3 TRIX (ROC of T6)_v1
Download script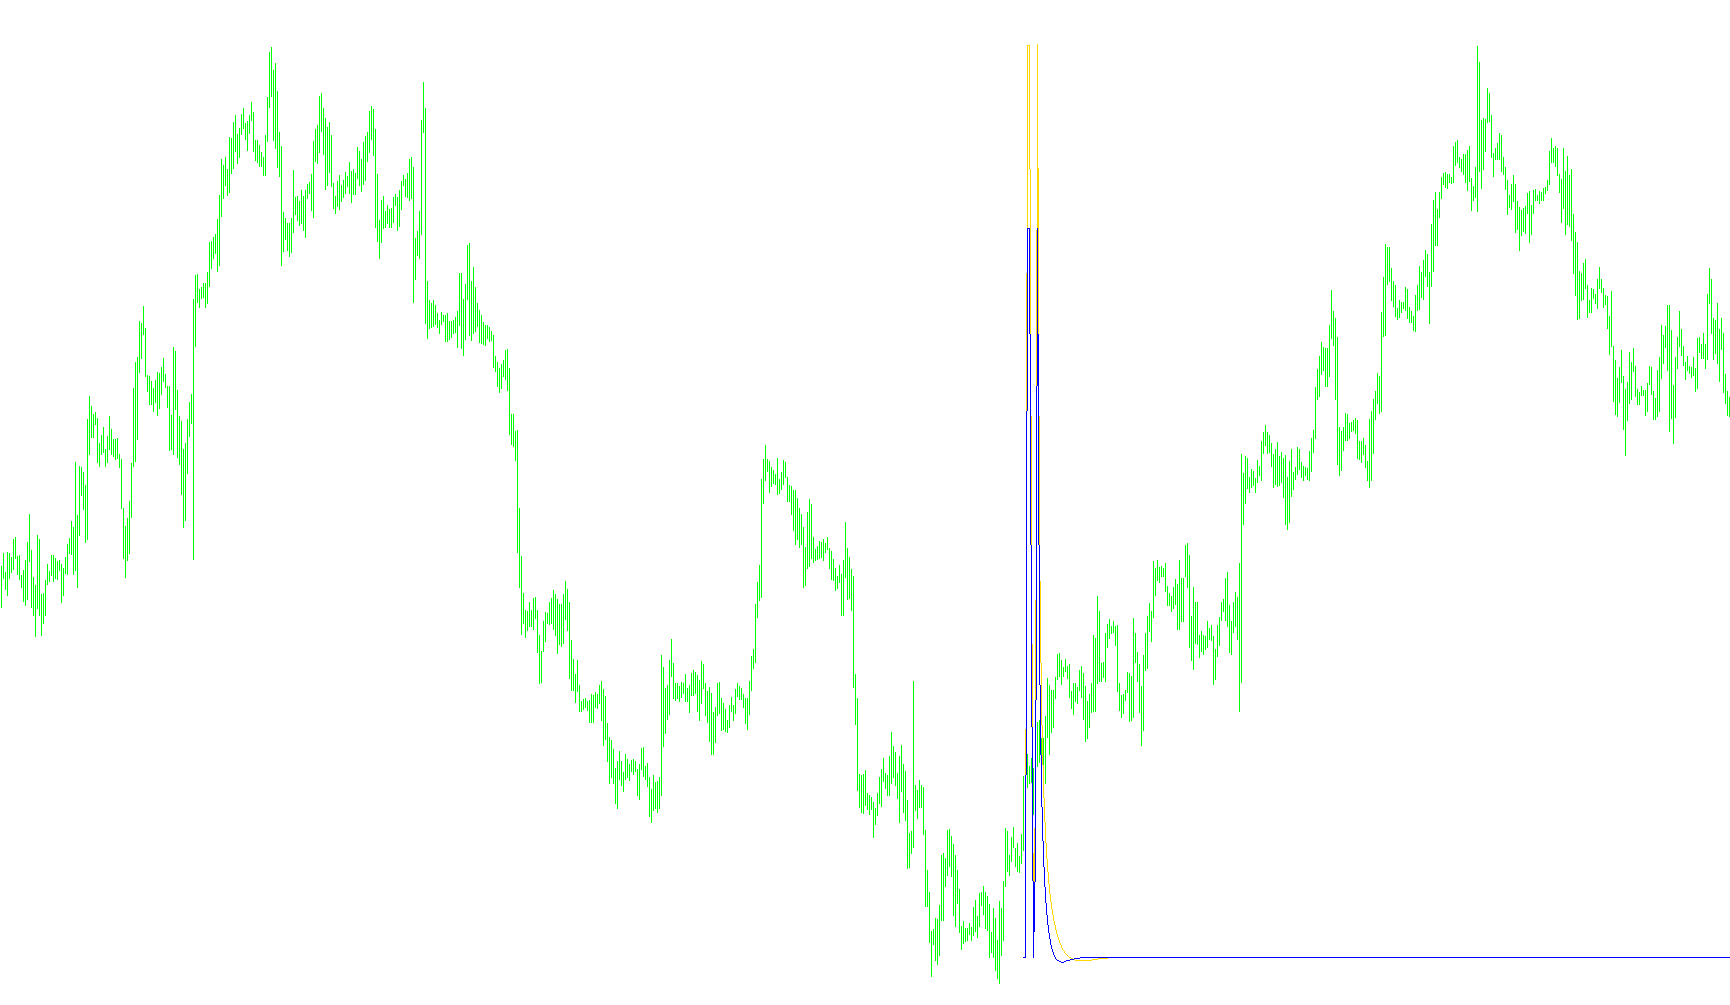
This script is a specialized technical analysis tool designed to measure momentum and price velocity through a multi-layered smoothing process. Instead of simply tracking the raw price of an asset, it applies complex mathematical filters to identify underlying trends, helping traders see "through" the market noise.
Core Logic Overview
The indicator operates by calculating two distinct types of smoothed data points (referred to as A and B). It processes these values through several stages to produce a momentum reading:
1. Multi-Stage Smoothing (T3 Filter) The script utilizes a variation of the "T3" moving average logic. Rather than a standard average, it passes the price through six successive layers of weighting. This creates a very smooth curve that remains responsive to new price movements while effectively filtering out minor, insignificant fluctuations.
2. Independent Data Streams The logic maintains two separate calculation paths:
- Stream A: Primarily focuses on the primary timeframe or base period defined by the user.
- Stream B: Operates on a secondary acceleration period (the "ROC of T6" logic), which allows the indicator to observe how the price velocity is changing relative to itself.
3. Momentum and Differential Calculation Once the smoothing layers are complete, the script calculates the Rate of Change (ROC). Rather than showing you the smoothed price, it displays the speed at which that price is moving.
The final output is presented in two ways depending on your settings:
- Individual Momentum: It tracks how fast Stream A is moving independently.
- Combined Momentum: It calculates the total velocity by combining the rates of change from both Stream A and Stream B.
Key Functional Components
- Weighted Inputs: The user can choose whether the indicator bases its calculations on the "Open" price or the "Close" price, allowing for different sensitivities to price gaps or intraday movements.
- Dynamic Weighting: The script automatically calculates specific mathematical weights (constants) based on your input periods. This ensures that the smoothing is mathematically balanced regardless of how large or small you set the timeframes.
- Visual Output: The results are plotted in a separate window, showing two distinct lines. These lines represent the percentage-based velocity of the market, making it easier to identify when momentum is accelerating, decelerating, or reaching an exhaustion point.
Summary for the Trader
Essentially, this tool takes raw market price, cleans it through six layers of mathematical "filters" to remove noise, and then calculates how fast that cleaned price is moving. It tells you not just where the price is going, but how fast it is getting there, using two different perspectives (short and long) to provide a more complete picture of market energy.
/*-----------------------------+
|			       |
| Shared by www.Aptrafx.com    |
|			       |
+------------------------------*/

//+------------------------------------------------------------------+
//|                                          T3 TRIX (ROC of T6).mq4 |
//|                      convert FinGeR Alex orginal by Luis Damiani |
//|                                                                  |
//+------------------------------------------------------------------+
#property copyright "convert FinGeR Alex orginal by Luis Damiani"
#property link      ""

#property indicator_separate_window
#property indicator_buffers 2
#property indicator_color1 DeepSkyBlue
#property indicator_color2 Blue
//---- input parameters
extern int       A_t3_period=18;
extern int       num_bars=350;
extern int       is_A_open_price=0;
extern int       B_t3_period_ac=10;
extern int       diferential=0;
extern double    hot=0.7;
//---- buffers
double ExtMapBuffer1[];
double ExtMapBuffer2[];
//+------------------------------------------------------------------+
//| Custom indicator initialization function                         |
//+------------------------------------------------------------------+
int init()
  {
//---- indicators
   SetIndexStyle(0,DRAW_LINE);
   SetIndexBuffer(0,ExtMapBuffer1);
   SetIndexStyle(1,DRAW_LINE);
   SetIndexBuffer(1,ExtMapBuffer2);
//----
   return(0);
  }
//+------------------------------------------------------------------+
//| Custor indicator deinitialization function                       |
//+------------------------------------------------------------------+
int deinit()
  {
//----

//----
   return(0);
  }
//+------------------------------------------------------------------+
//| Custom indicator iteration function                              |
//+------------------------------------------------------------------+
int start()
  {

int  shift=0;
double A_t3=0,A_t3_1=0,max_per=0;
double  B_t3=0,B_t3_1=0;
double e1=0,e2=0,e3=0,e4=0,e5=0,e6=0,c1=0,c2=0,c3=0,c4=0;
double e1x=0,e2x=0,e3x=0,e4x=0,e5x=0,e6x=0;
double d1=0,d2=0,d3=0,d4=0,d5=0,d6=0;
double d1x=0,d2x=0,d3x=0,d4x=0,d5x=0,d6x=0;
double n=0,A_w1=0,A_w2=0,B_w1=0,B_w2=0,b2=0,b3=0;
double init=true;
double bar=0, prevbars=0, start=0, cs=0, prevcs=0,frame=0;
string commodt="nonono";
int    counted_bars=IndicatorCounted();

cs = num_bars+A_t3_period+is_A_open_price+B_t3_period_ac+diferential+hot;

if (cs==prevcs && commodt==Symbol() && frame==Time[4]-Time[5] && Bars-prevbars<2)
start=Bars-prevbars;
else start=-1;
commodt=Symbol();
frame=Time[4]-Time[5];
prevbars = Bars;
prevcs = cs;

if (start==1 || start==0)  bar=start; else init=true;

if (init==true)
{
  b2=hot*hot;
  b3=b2*hot;
  c1=-b3;
  c2=(3*(b2+b3));
  c3=-3*(2*b2+hot+b3);
  c4=(1+3*hot+b3+3*b2);

  n=A_t3_period;

  if (n<1) n=1;

  n = 1 + 0.5*(n-1);
  A_w1 = 2 / (n + 1);
  A_w2 = 1 - A_w1;

 n=B_t3_period_ac;

  if (n<1) n=1;
  n = 1 + 0.5*(n-1);
  B_w1 = 2 / (n + 1);
  B_w2 = 1 - B_w1;

ExtMapBuffer1[num_bars-1]=0;


e1x=0;e2x=0;e3x=0;e4x=0;e5x=0;e6x=0;

ExtMapBuffer2[num_bars-1]=0;

d1x=0;d2x=0;d3x=0;d4x=0;d5x=0;d6x=0;

// max_per=max(A_t3_period,B_t3_period_ac);
bar=num_bars-2;
init=false;
}


//SetLoopCount(0);
shift=bar;

while(shift>=0)

{

 if ( is_A_open_price==1 ) d1 = A_w1*Open[shift] + A_w2*d1x;
  else d1 = A_w1*Close[shift] + A_w2*d1x;
  d2 = A_w1*d1 + A_w2*d2x;
  d3 = A_w1*d2 + A_w2*d3x;
  d4 = A_w1*d3 + A_w2*d4x;
  d5 = A_w1*d4 + A_w2*d5x;
  d6 = A_w1*d5 + A_w2*d6x;

  A_t3 = c1*d6 + c2*d5 + c3*d4 + c4*d3;


if ((start==1 && shift==1) || start==-1  )
{

  d1x=d1;
  d2x=d2;
  d3x=d3;
  d4x=d4;
  d5x=d5;
  d6x=d6;
  }
  e1 = B_w1*Close[shift] + B_w2*e1x;
  e2 = B_w1*e1 + B_w2*e2x;
  e3 = B_w1*e2 + B_w2*e3x;
  e4 = B_w1*e3 + B_w2*e4x;
  e5 = B_w1*e4 + B_w2*e5x;
  e6 = B_w1*e5 + B_w2*e6x;
B_t3 = c1*e6 + c2*e5 + c3*e4 + c4*e3;

  if(diferential==1)
  {

   ExtMapBuffer1[shift]=(A_t3-A_t3_1)/A_t3_1;
   ExtMapBuffer2[shift]=(A_t3-A_t3_1)/A_t3_1+(B_t3-B_t3_1)/B_t3_1;


  }
  else
  {

if ( B_t3_1 >0 && A_t3_1>0) {
ExtMapBuffer2[shift]=(B_t3-B_t3_1)/B_t3_1;
ExtMapBuffer1[shift]=(A_t3-A_t3_1)/A_t3_1;
}
  //Comment("0");

  }

 //Comment("  start: ",start,"  bar: ",bar,"\n",
//"frame: ",frame,"  num_bars:" ,num_bars," commodity: ",commodt ,"\n",(B_t3-B_t3_1)/B_t3_1);

if ((start==1 && shift==1) || start==-1)
{
//Comment("Bar=ghfghfgh");
  A_t3_1=A_t3;
  B_t3_1=B_t3;
  e1x=e1;
  e2x=e2;
  e3x=e3;
  e4x=e4;
  e5x=e5;
  e6x=e6;

 }

  shift--;
//Comment("View !!!  NO?????");
   }
//----


  }
//+------------------------------------------------------------------+
Comments