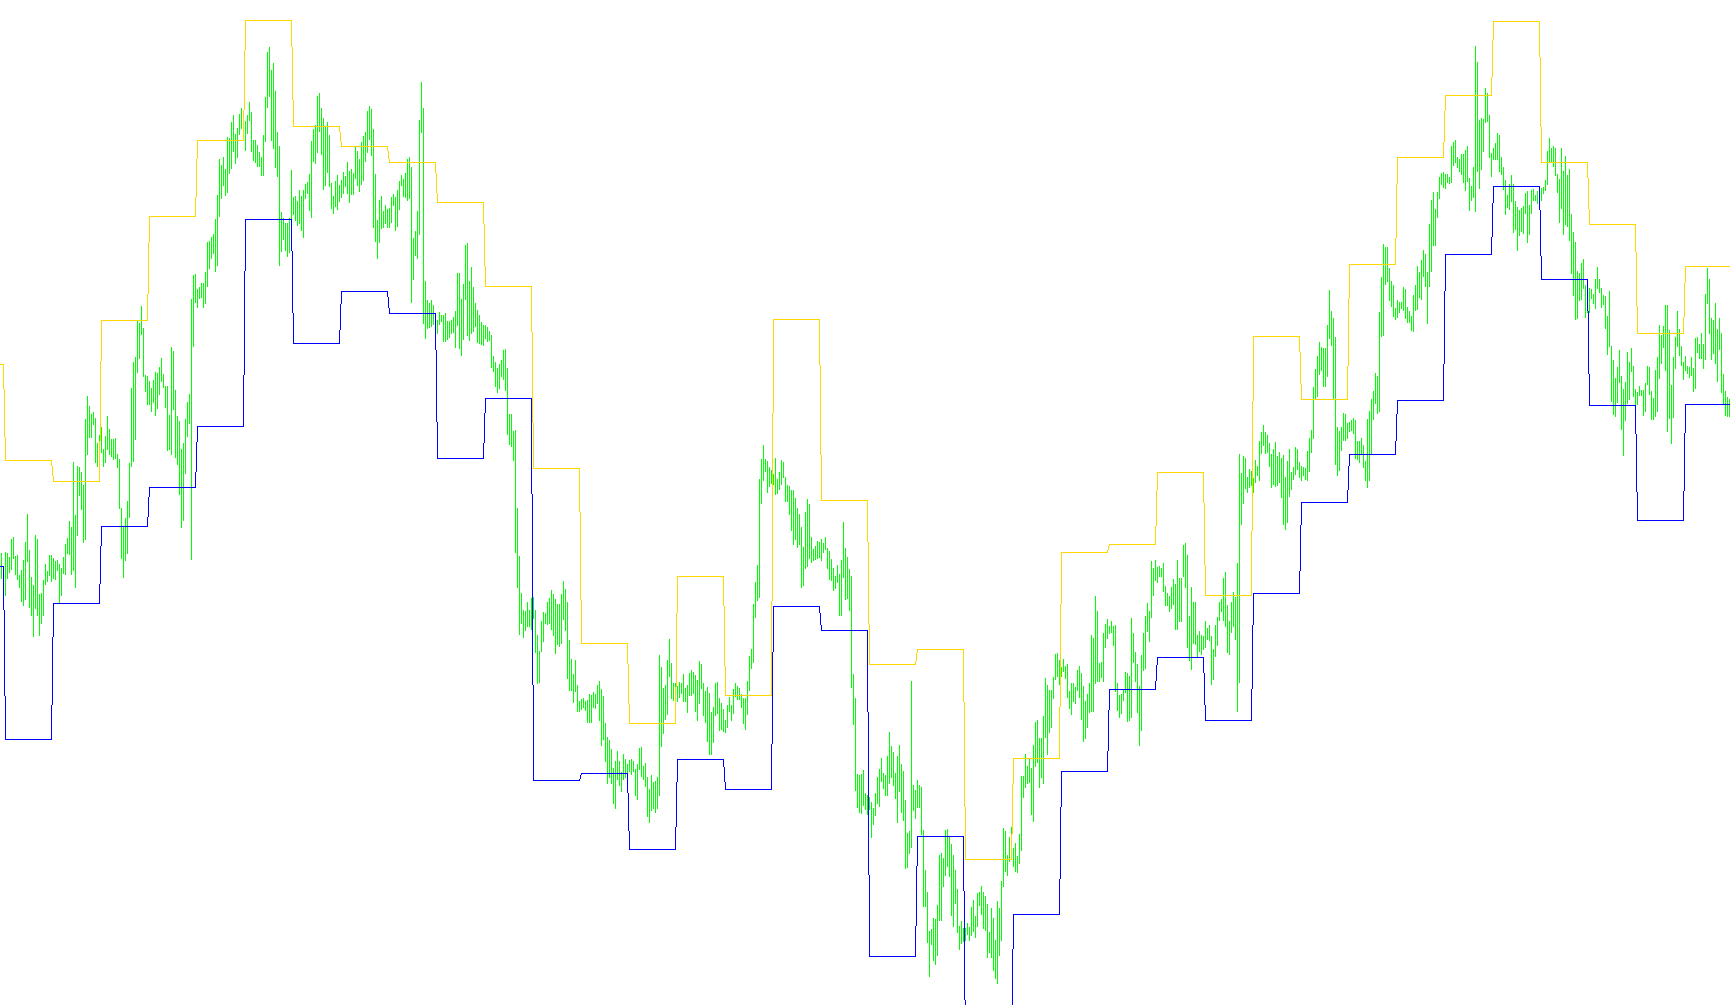
This tool is designed to provide traders with visual data points on their charts to help identify potential price levels based on daily market activity. Rather than simply looking at the current price, it calculates specific "pivot" values by analyzing the relationship between the previous day's high, low, open, and closing prices.
How the Logic Works
The script operates by scanning your historical data and identifying the start of every new trading day. Once a new day is identified, the tool performs a calculation to determine two key price levels: a "High" level and a "Low" level.
The core logic relies on how the previous day's market session concluded. It looks at whether the market closed higher or lower than it opened, and then applies a specific mathematical weight to the daily extremes (the highest and lowest points reached).
- If the previous day closed lower than it opened: The calculation gives more weight to the previous day's low price.
- If the previous day closed higher than it opened: The calculation gives more weight to the previous day's high price.
- If the previous day closed exactly at the opening price: It balances the weights between the high and low prices equally.
Visual Representation
Once these calculations are performed, the script draws two distinct lines on your chart:
- The High Level (Royal Blue): A calculated price point representing a potential upper boundary or resistance area based on that day's logic.
- The Low Level (Orange Red): A calculated price point representing a potential lower boundary or support area.
Purpose for the Trader
By automating these calculations, the tool eliminates the need for manual math. It allows you to see at a glance where the "Pivot" points sit for the current day. These levels serve as visual guides to help you understand market structure, identifying where price might react, stall, or reverse based on the momentum of the previous trading session.
//+------------------------------------------------------------------+
//|                                                     TD Pivot.mq4 |
//+------------------------------------------------------------------+
#property indicator_chart_window
#property indicator_buffers 2
#property indicator_color1 RoyalBlue
#property indicator_color2 OrangeRed

//---- buffers
double high[],
       low[];

//+------------------------------------------------------------------+
//| Custom indicator initialization function                         |
//+------------------------------------------------------------------+
int init()
{
   IndicatorShortName("TD Pivot");
//---- indicators
   SetIndexLabel (0,"High");
   SetIndexStyle (0,DRAW_LINE);
   SetIndexBuffer(0,high);
   SetIndexLabel (1,"Low");
   SetIndexStyle (1,DRAW_LINE);
   SetIndexBuffer(1,low);
//----
   return(0);
}

//+------------------------------------------------------------------+
//| Custom indicator iteration function                              |
//+------------------------------------------------------------------+
int start()
{
//----
   for (int i = Bars-IndicatorCounted(); i >= 0; i--)
   {
      if(TimeHour(iTime(NULL,0,i)) != 0)
      {
         high[i] = high[i+1];
         low[i]  = low[i+1];
         continue;
      }

      int candlesPerDay = PERIOD_D1/Period(),
          day           = MathFloor(i/candlesPerDay)+1;

      double H = iHigh(NULL,PERIOD_D1,day),
             L = iLow(NULL,PERIOD_D1,day),
             O = iOpen(NULL,PERIOD_D1,day),
             C = iClose(NULL,PERIOD_D1,day),
             X;

      if      (C < O)  X =   H + 2*L +   C;
      else if (C > O)  X = 2*H +   L +   C;
      else if (C ==O)  X =   H +   L + 2*C;

      high[i] = 0.5*X - L;
      low[i]  = 0.5*X - H;
   }
//----
   return(0);
}
//+------------------------------------------------------------------+
Comments