TD_Points_Line_mgtd1
Download script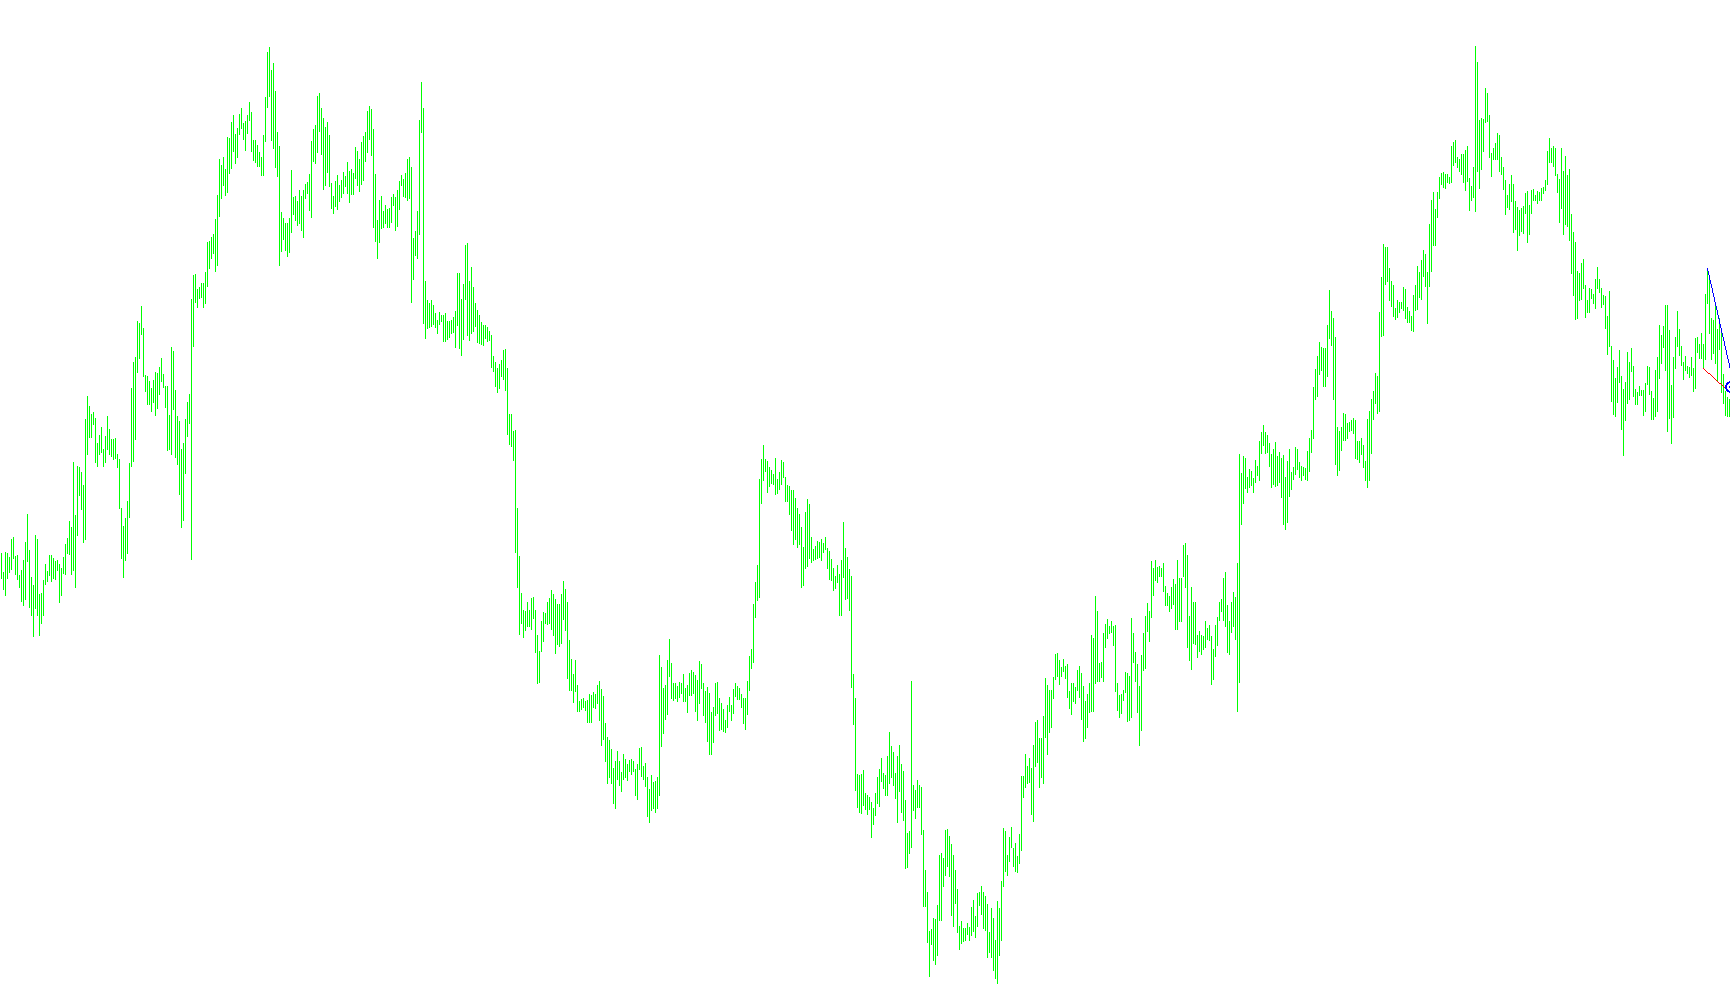
Overview
This script is an automated technical analysis tool designed to identify specific price action patterns, specifically focusing on supply and demand dynamics. It visualizes key market "boundaries" and identifies potential breakout points where the price might shift direction significantly.
Core Logic and Functionality
The logic of this tool can be broken down into three primary phases: identifying market boundaries, calculating trends, and forecasting targets.
1. Identification of Supply and Demand Zones
The script scans historical price data to locate significant peaks and troughs. It looks for specific conditions where the price reaches a "high" or "low" relative to its immediate surroundings.
- Supply Points (Resistance): The tool identifies local highs that stand out from preceding price action. These are represented on your chart as blue trend lines, marking areas where selling pressure has historically been dominant.
- Demand Points (Support): Conversely, the tool locates local lows where buying interest was high. These are marked as red trend lines, representing "floors" in the market price.
2. Trend Analysis and Slope Calculation
Once the primary supply and demand points are established, the script calculates the "velocity" or slope of these boundaries. It determines how much the price moves between two consecutive identified points over a specific period. This allows the tool to understand the trajectory of the current market structure rather than just viewing static lines.
3. Breakout Detection and Target Projection
This is the most advanced part of the script's logic. Instead of just showing you where the price was, it tries to predict where the price might go next if a breakout occurs.
- Breakout Signaling: The script constantly monitors the current price action against the calculated trend lines. When the price "breaks" through a detected supply or demand boundary, the tool identifies the exact moment of intersection. It then places an arrow on the chart to signal this breach.
- Target Calculation: Upon detecting a breakout, the tool performs a mathematical projection. It takes the historical price extremes (the highest highs and lowest lows) from the previous structure and projects them forward.
- Dynamic Target Line: Based on these projections, it calculates an average "target" price. This target is then displayed as a horizontal line on your chart, providing a visual goal for where the price might settle after the trend reverses or continues.
User Experience Summary
For the end user, this script automates the tedious process of manually drawing support and resistance lines. It provides a real-time visual map of the market's "geography" (the lines), alerts you when the current price is challenging those boundaries (the arrows), and suggests a logical destination for the price once that challenge succeeds (the target line).
//+------------------------------------------------------------------+
//|                                        TD_Points&Lines_mgtd1.mq4 |
//|                                           Vladislav Goshkov (VG) |
//|                                                      4vg@mail.ru |
//+------------------------------------------------------------------+
#property copyright "Vladislav Goshkov (VG)"
#property link      "4vg@mail.ru"

#property indicator_chart_window

extern int SetPoint=0;
extern int StepBack=0;
extern int Qw1=1;
extern int Qw2=1;
extern int Qw3=1;

int i=1,NP=0,D=0,
    iB_Up=0,iB_Dn=0,
    S1=0,
    S2=0,
    UpLev=0,
    DownLev=0,
    iP_Up=0,
    iP_Dn=0,
    value=0,
    CurPeriod=0,
    shift=0;

datetime  nTime=0;

double UpV=0,
       DownV=0,
       iP=0,
       target = 0,
       UpP[2]={0,0},
       DownP[2]={0,0},
       PP1=0,PP2=0,PP3=0;

int    DownBT[2]={0,0}, // Bar Time
       UpBT[2]={0,0},
       UpB[2]={0,0},    // Bar Num
       DownB[2]={0,0};
string buff_str = "";
//+------------------------------------------------------------------+
//| Custom indicator initialization function                         |
//+------------------------------------------------------------------+
int init()
  {
//---- indicators
//----
   return(0);
  }
//+------------------------------------------------------------------+
//| Custor indicator deinitialization function                       |
//+------------------------------------------------------------------+
int deinit()
  {
//---- TODO: add your code here
Comment(" ");
ObjectDelete("TD_Up");
ObjectDelete("TD_Dn");
ObjectDelete("Target");
ObjectDelete("Break_Sig_Up");
ObjectDelete("Break_Sig_Dn");
//----
   return(0);
  }
//+------------------------------------------------------------------+
//| Custom indicator iteration function                              |
//+------------------------------------------------------------------+
int start()
  {
   //int    counted_bars=IndicatorCounted();
//---- TODO: add your code here
if ( (nTime!=Time[0]) || (CurPeriod!=Period()) ) {
   UpP[0] = 0;
   UpP[1] = 0;

//=================================================
//******** Ïîèñê îïîðíûõ òî÷åê ïðåäëîæåíèÿ ********
//=================================================
   for(i=2+StepBack,D=2,NP=0; (NP<D)&&(i<Bars); i++) {//Begin
       if (High[i]!= High[i+1]) {
          if( (High[i]>High[i+1] && High[i]>High[i-1] && High[i]>Close[i+2] )
              && High[i]> UpP[0] ) {
	     	 UpB[NP]  = i;
		    UpBT[NP] = Time[i];
		    UpP[NP]  = High[i];
		    NP++;
		    }
		  }

    if (High[i]== High[i+1])  {
       if ( (High[i]>High[i+2] && High[i]>High[i-1] && High[i]>Close[i+3] ) && High[i]> UpP[0] ) {
	     	 UpB[NP]  = i;
		    UpBT[NP] = Time[i];
		    UpP[NP]  = High[i];
		    NP++;
		    }
		  }
     if(i == (Bars-2) ) {
	     	 UpB[NP]  = i;
		    UpBT[NP] = Time[i];
		    UpP[NP]  = High[i];
		    break;
		    }
     }//for(i=2+StepBack,D=2,NP=0; NP<D; ) {//End;

//=================================================
//********** Ïîèñê îïîðíûõ òî÷åê ñïðîñà ***********
//=================================================
   DownP[0] = 1000000000;
   DownP[1] = 1000000000;
   for(i=2+StepBack,D=2,NP=0; (NP<D)&&(i<Bars); i++) {//Begin
    if (Low[i]!= Low[i+1])  {
       if ( (Low[i]<Low[i+1] && Low[i]<Low[i-1] && Low[i]<Close[i+2] ) && Low[i]< DownP[0] ){
	  	    DownB[NP] = i;
		    DownBT[NP]= Time[i];
		    DownP[NP] = Low[i];
		    NP++;
		    }
		  //i++;
		  };
    if (Low[i]== Low[i+1])  {
       if ( (Low[i]<Low[i+2] && Low[i]<Low[i-1] && Low[i]<Close[i+3] ) && Low[i]< DownP[0] ){
	  	    DownB[NP] = i;
		    DownBT[NP]= Time[i];
		    DownP[NP] = Low[i];
		    NP++;
		    }
		  //i++;
		  };
     if (i == (Bars-2) ) {
	  	    DownB[NP] = i;
		    DownBT[NP]= Time[i];
		    DownP[NP] = Low[i];
		    break;
		    };
     }//End;


UpV = (UpP[1]-UpP[0])/(UpB[0]-UpB[1]);
DownV = (DownP[1]-DownP[0])/(DownB[0]-DownB[1]);

//=================================================
//****       Ðèñóåì  TD-ëèíèè                  ****
//=================================================
   buff_str = "TD_Up";
   if(ObjectFind(buff_str) == -1) {
      ObjectCreate(buff_str, OBJ_TREND, 0, UpBT[1], UpP[1],UpBT[0], UpP[0]);
      ObjectSet(buff_str, OBJPROP_STYLE, STYLE_SOLID);
      ObjectSet(buff_str, OBJPROP_COLOR, Blue);
      //ObjectMove(buff_str, 0, UpBT[1], UpP[1],UpBT[0], UpP[0]);
      }
   else {
      ObjectMove(buff_str, 1, UpBT[0], UpP[0]);
      ObjectMove(buff_str, 2, UpBT[1], UpP[1]);
      }

   buff_str = "TD_Dn";
   if(ObjectFind(buff_str) == -1) {
      ObjectCreate(buff_str, OBJ_TREND, 0, DownBT[1], DownP[1],DownBT[0], DownP[0]);
      ObjectSet(buff_str, OBJPROP_STYLE, STYLE_SOLID);
      ObjectSet(buff_str, OBJPROP_COLOR, Red);
      //ObjectMove(buff_str, 0, UpBT[1], UpP[1],UpBT[0], UpP[0]);
      }
   else {
      ObjectMove(buff_str, 1, DownBT[0], DownP[0]);
      ObjectMove(buff_str, 2, DownBT[1], DownP[1]);
      }

   CurPeriod = Period();
   nTime = Time[0];
   }//if (nTime <> Time[0]) {
//----
   target = 0;

	for( i=UpB[0]; i>=StepBack; i--){
	   if( (Close[i]>UpP[0]+UpV*(UpB[0]-i)) && (Close[i+1]<UpP[0]+UpV*(UpB[0]-(i+1))) ) {
		    iB_Up=i;
		    iP=UpP[0]+UpV*(UpB[0]-i);
		    iP_Up = iP;
		    S1=Lowest(NULL,0,MODE_LOW,UpB[1],0);
		    S2=Lowest(NULL,0,MODE_CLOSE,UpB[1],0);

	       PP1=iP+((UpP[1]+UpV*(UpB[1]-S1))-Low[S1]);
	       PP2=iP+((UpP[1]+UpV*(UpB[1]-S2))-Low[S2]);
          PP3=iP+((UpP[1]+UpV*(UpB[1]-S1))-Close[S1]);
		    if((Qw1!=0 && Close[2]>Close[1])
          || (Qw2!=0 && Open[0]> iP)
          || (Qw3!=0 && (Close[0]+(Close[0]-MathMin(Low[0],Close[1])))<iP) ) {
             target = (PP1+PP2+PP3)/3;
             buff_str = "Break_Sig_Up";
             if(ObjectFind(buff_str) == -1) {
                ObjectCreate(buff_str, OBJ_ARROW,0, Time[iB_Up], iP+2*Point );
                ObjectSet(buff_str, OBJPROP_ARROWCODE, 164);
                ObjectSet(buff_str, OBJPROP_COLOR, Red);
                }
             else {
                ObjectMove(buff_str, 0, Time[iB_Up], iP+2*Point );
                }
             }
		    }
	   }

   for( i=DownB[0]; i>=StepBack;i--) {
	   if( (Close[i]<DownP[0]+DownV*(DownB[0]-i)) && (Close[i+1]>DownP[0]+DownV*(DownB[0]-(i+1))) ) {
	       iB_Dn=i;
		    iP=DownP[0]+DownV*(DownB[0]-i);
		    iP_Dn = iP;
		    S1=Highest(NULL,0,MODE_HIGH,DownB[1],0);
		    S2=Highest(NULL,0,MODE_CLOSE,DownB[1],0);

          PP1=iP-(High[S1]-(DownP[1]+DownV*(DownB[1]-S1)));
	       PP2=iP-(High[S2]-(DownP[1]+DownV*(DownB[1]-S2)));
	       PP3=iP-(Close[S1]-(DownP[1]+DownV*(DownB[1]-S1)));
    		 if((Qw1!=0 && Close[1]<Close[0] )
          || (Qw2!=0 && Open[0] < iP )
		    || (Qw3!=0 && (Close[0]+(Close[0]-MathMax(High[0],Close[1])))>iP) ) {
             target = (PP1+PP2+PP3)/3;
             buff_str = "Break_Sig_Dn";
             if(ObjectFind(buff_str) == -1) {
                ObjectCreate(buff_str, OBJ_ARROW,0, Time[iB_Dn], iP+2*Point );
                ObjectSet(buff_str, OBJPROP_ARROWCODE, 164);
                ObjectSet(buff_str, OBJPROP_COLOR, Blue);
                }
             else {
                ObjectMove(buff_str, 0, Time[iB_Dn], iP+2*Point );
                }
             }
 		    }
		}//for( i=DownB[1]; i>=StepBack;i--) {

   buff_str = "Target";
   if(ObjectFind(buff_str) == -1) {
      ObjectCreate(buff_str, OBJ_HLINE,0, Time[0], target );
      ObjectSet(buff_str, OBJPROP_STYLE, STYLE_SOLID);
      ObjectSet(buff_str, OBJPROP_COLOR, Blue);
      //ObjectMove(buff_str, 0, UpBT[1], UpP[1],UpBT[0], UpP[0]);
      }
   else {
      ObjectMove(buff_str, 0, Time[0], target );
      }


//----
   return(0);
  }
//+------------------------------------------------------------------+
Comments