test_5F5close_up
Download script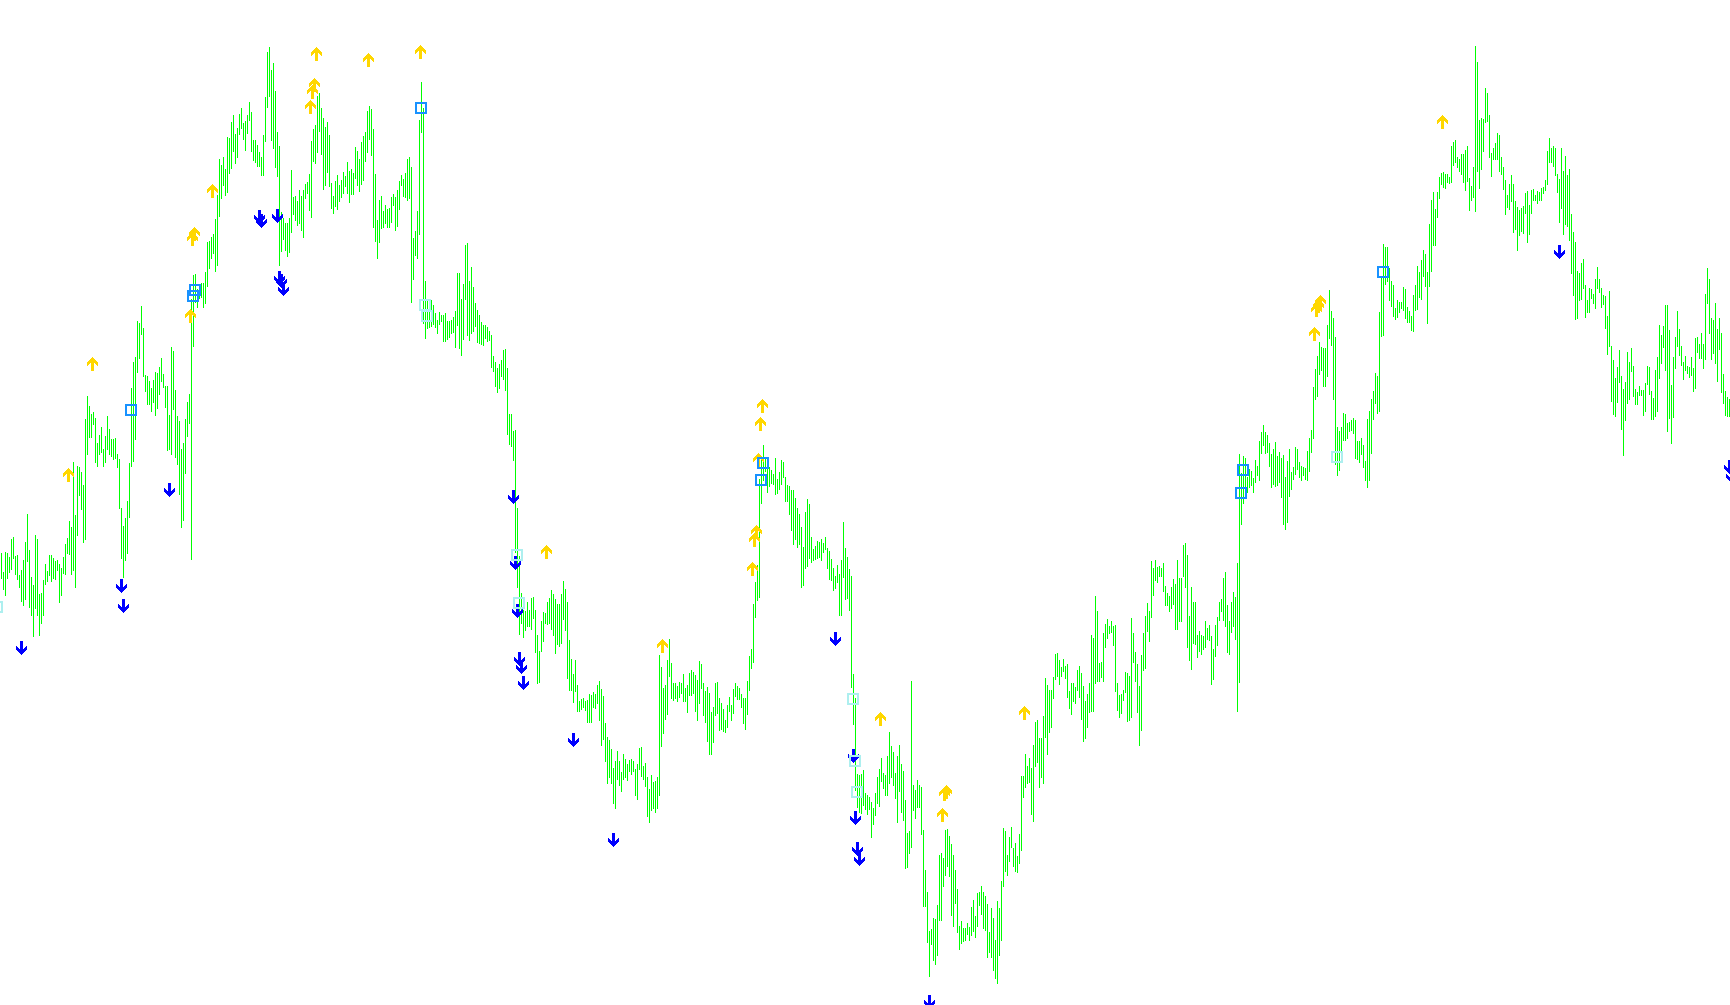
This custom indicator for the MetaTrader platform is designed to analyze price action by identifying specific momentum shifts and trend continuations. It works by calculating a "Typical Price" for each candle—a baseline value derived from a candle's high, low, and closing prices—and then evaluates these values over a rolling period to signal potential market movements.
The logic is divided into two primary detection methods:
1. Momentum Gap Detection
The script monitors the cumulative change in price over a three-period sequence. It calculates the total movement from the past to the present and compares it against a user-defined "Gap Size."
- Downside Movement: If the price drops significantly enough over these three periods to meet or exceed the specified gap, the indicator places a signal on the chart.
- Upside Movement: Conversely, if the price rises sharply enough to meet the negative threshold of that gap, it triggers a separate corresponding signal.
2. Trend Continuity Tracking
In addition to detecting sudden gaps, the script tracks consistent directional flow by looking at a six-period window. It looks for "perfect" sequences where every single candle in that six-period chain moves in the same direction relative to the one before it.
- Descending Trends: If there is a continuous five-step decline (where each price point is lower than the previous one), the script identifies a sustained downward trend and places a marker on the chart.
- Ascending Trends: If there is a continuous five-step rise (where each price point is higher than the previous one), it identifies a sustained upward trend and places a corresponding marker.
Visual Representation
To make this data easy to read, the script translates these mathematical conditions into visual symbols directly on your trading chart:
- Arrows: These highlight specific momentum gaps or trend shifts at exact price points.
- Color Coding: The indicator uses distinct colors (Red and White) to differentiate between bullish (upward) pressure and bearish (downward) pressure, allowing traders to quickly identify the prevailing market sentiment at a glance.
/*-----------------------------+
|			       |
| Shared by www.Aptrafx.com    |
|			       |
+------------------------------*/

//+------------------------------------------------------------------+
//| test.mq4                                                         |
//+------------------------------------------------------------------+
#property copyright "Ron T"
#property link      "http://www.lightpatch.com"

#property indicator_chart_window
#property indicator_buffers 4
#property indicator_color1 White
#property indicator_color2 Red
#property indicator_color3 Red
#property indicator_color4 White

//---- buffers
double ExtMapBuffer1[];
double ExtMapBuffer2[];
double ExtMapBuffer3[];
double ExtMapBuffer4[];

// User Input
extern double Gap_Size=0.0030;


//+------------------------------------------------------------------+
//| Custom indicator initialization function                         |
//|------------------------------------------------------------------|

int init()
  {

   SetIndexStyle(0,DRAW_ARROW);
   SetIndexBuffer(0, ExtMapBuffer1);
   SetIndexArrow(0,233); //up red

   SetIndexStyle(1,DRAW_ARROW);
   SetIndexBuffer(1, ExtMapBuffer2);
   SetIndexArrow(1,234); //down white

   SetIndexStyle(2,DRAW_ARROW);
   SetIndexBuffer(2, ExtMapBuffer3);
   SetIndexArrow(2,168);  // Red

   SetIndexStyle(3,DRAW_ARROW);
   SetIndexBuffer(3, ExtMapBuffer4);
   SetIndexArrow(3,168);  // White

   return(0);
  }


//+------------------------------------------------------------------+
//| Custor indicator deinitialization function                       |
//+------------------------------------------------------------------+
int deinit()
  {
   int i;

   for( i=0; i<Bars; i++ ) ExtMapBuffer1[i]=0;
   for( i=0; i<Bars; i++ ) ExtMapBuffer2[i]=0;
   for( i=0; i<Bars; i++ ) ExtMapBuffer3[i]=0;
   for( i=0; i<Bars; i++ ) ExtMapBuffer4[i]=0;

   return(0);
  }


//+------------------------------------------------------------------+
//| Custom indicator iteration function                              |
//+------------------------------------------------------------------+
int start()
  {
   double oTYP0=0, oTYP1=0, oTYP2=0, oTYP3=0, oTYP4=0, oTYP5=0;

   int pos=Bars;

   while(pos>=0)
     {
      // six-period typical
      oTYP0=(High[pos+0]+Low[pos+0]+Close[pos+0]+Close[pos+0])/4;
      oTYP1=(High[pos+1]+Low[pos+1]+Close[pos+1]+Close[pos+1])/4;
      oTYP2=(High[pos+2]+Low[pos+2]+Close[pos+2]+Close[pos+2])/4;
      oTYP3=(High[pos+3]+Low[pos+3]+Close[pos+3]+Close[pos+3])/4;
      oTYP4=(High[pos+4]+Low[pos+4]+Close[pos+4]+Close[pos+4])/4;
      oTYP5=(High[pos+5]+Low[pos+5]+Close[pos+5]+Close[pos+5])/4;

      //three-period ten-pip gap DOWN
      if ( (oTYP3-oTYP2)+(oTYP2-oTYP1)+(oTYP1-oTYP0) >= Gap_Size )
        {
         ExtMapBuffer3[pos]=oTYP0;
         ExtMapBuffer4[pos]=0;
        }

      //three-period ten-pip gap UP
      if ( (oTYP3-oTYP2)+(oTYP2-oTYP1)+(oTYP1-oTYP0) <= Gap_Size*(-1) )
        {
         ExtMapBuffer4[pos]=0;
         ExtMapBuffer4[pos]=oTYP0;
        }


      // six-period down
      if(oTYP5 > oTYP4 && oTYP4 > oTYP3 && oTYP3 > oTYP2 && oTYP2 > oTYP1 && oTYP1 > oTYP0)
        {
         ExtMapBuffer1[pos]=0;
         ExtMapBuffer2[pos]=oTYP0-0.0015;  //down red
        }


      if(oTYP5 < oTYP4 && oTYP4 < oTYP3 && oTYP3 < oTYP2 && oTYP2 < oTYP1 && oTYP1 < oTYP0)
        {
         // six-period up
         ExtMapBuffer1[pos]=oTYP0+0.0015;  //up white
         ExtMapBuffer2[pos]=0;
        }
 	   pos--;
     }

   return(0);
  }
//+------------------------------------------------------------------+
Comments