test2_v1
Download script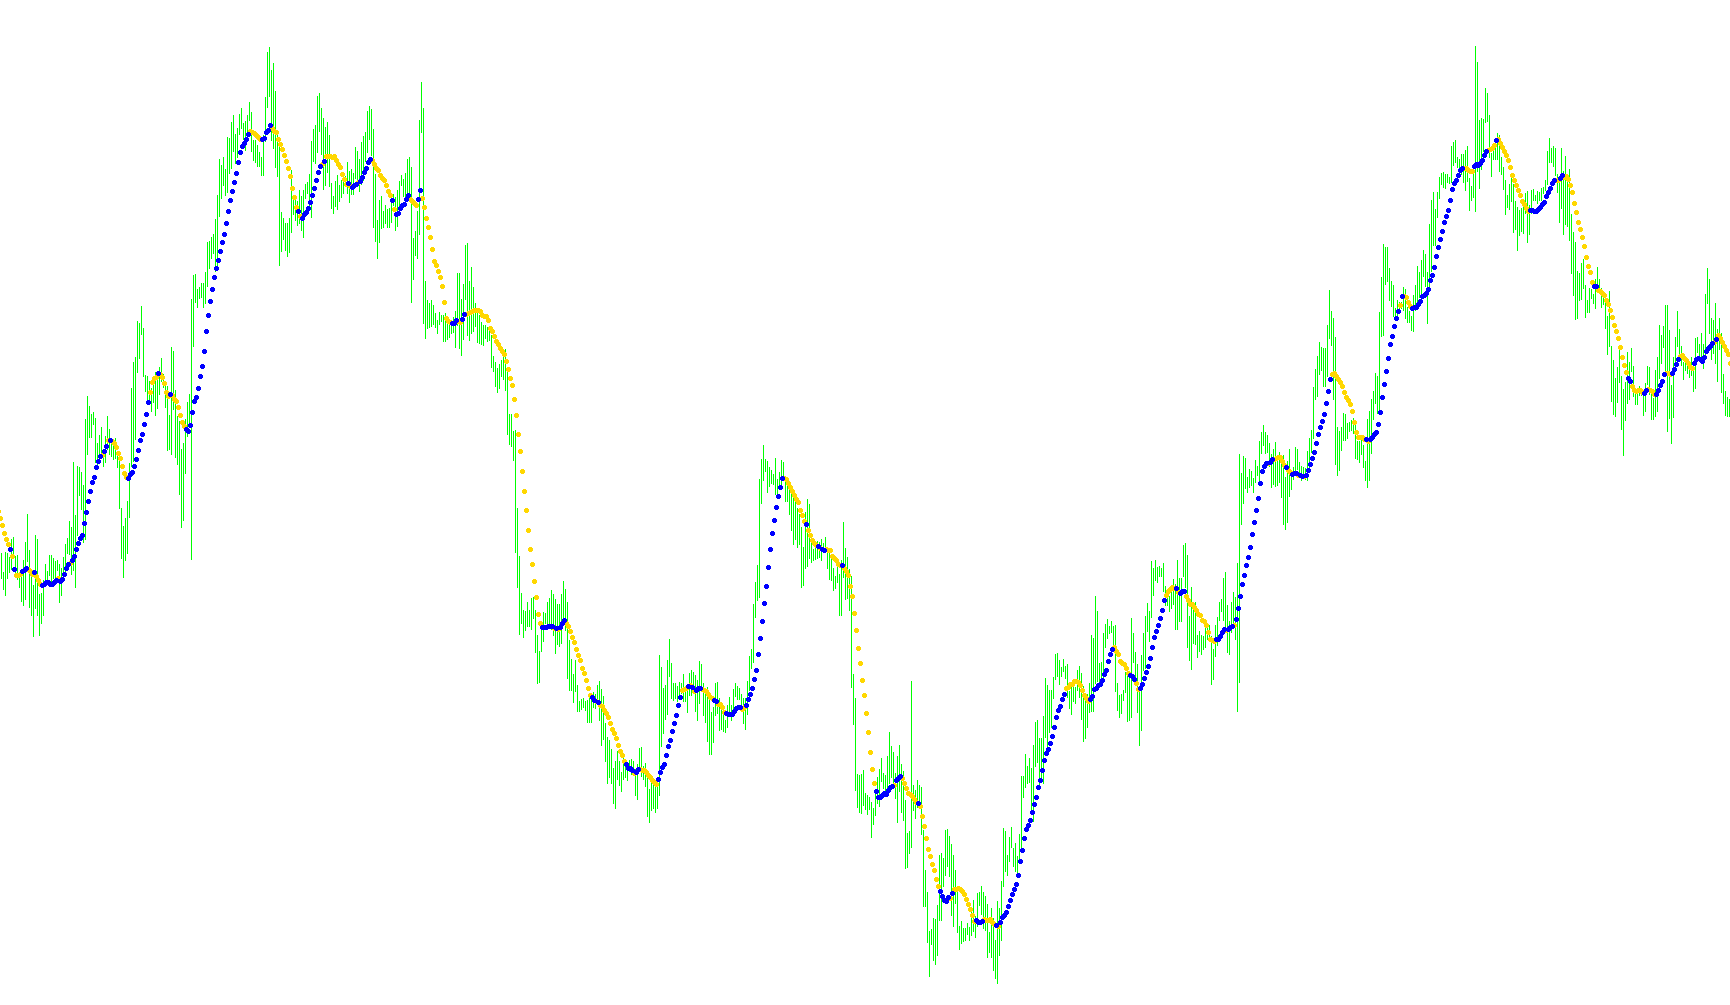
This tool is designed for traders who want to visualize price momentum and identify specific trend shifts on a trading chart. Instead of simply showing a smooth moving average line, this script acts as a dynamic signal system that highlights changes in price behavior over a specific period of time.
Core Logic and Functionality
The script works by analyzing the relationship between recent closing prices and a calculated average. Here is a breakdown of how it processes information:
1. Trend Detection and Direction The tool continuously calculates a moving average based on a user-defined timeframe (the period). It compares the current average against the previous average to determine the direction of the market.
- If the average is trending upward, the script identifies an "upward" state.
- If the average is trending downward, it identifies a "downward" state.
2. Dynamic Visual Signaling Rather than drawing a continuous line that might clutter the screen, the script uses visual markers to represent these states:
- State Indicators: It distinguishes between upward and downward trends using two different visual outputs (represented by distinct colors on your chart). This allows you to see at a glance which way the momentum is currently leaning.
- Filtered Signal Strength: The logic includes a sensitivity threshold. The script doesn't just mark every tiny fluctuation; it looks at the "change" in price over a specific interval. If that change exceeds a level you set (the indicator change), it triggers a specific highlight or marker.
3. Noise Reduction A key feature of this logic is its ability to filter out minor market "noise." By comparing the current price action against a fixed historical point within the look-back period, it ensures that markers are only displayed when there is a significant enough move to be considered meaningful by the user's standards.
How to Interpret the Output
When you use this on a chart, you are looking for these visual markers to confirm market sentiment:
- Trend Confirmation: The primary markers show you the general path of the price (Up or Down).
- Significant Movement: The third set of markers identifies specific moments where the price movement was strong enough to surpass your chosen sensitivity level, helping you pinpoint high-momentum areas while ignoring small, insignificant wiggles in the market.
In summary, this script transforms raw price data into a visual map of momentum, helping you see not just where the price is going, but how strongly it is moving in that direction.
/*-----------------------------+
|			       |
| Shared by www.Aptrafx.com    |
|			       |
+------------------------------*/

//+------------------------------------------------------------------+
//|                                           MultiMovingAverage.mq4 |
//+------------------------------------------------------------------+
#property copyright "Ron T"
#property link      "http://www.lightpatch.com"

#property indicator_chart_window
#property indicator_buffers 3
#property indicator_color1 Red
#property indicator_color2 White
#property indicator_color3 DeepSkyBlue

//---- buffers
double ExtMapBuffer1[];
double ExtMapBuffer2[];
double ExtMapBuffer3[];

//----
int ExtCountedBars=0;

//---- indicator parameters
extern int MA_Period=13;
extern int Plot_Character=159;
extern double indChange=0.01;


//+------------------------------------------------------------------+
//| Custom indicator initialization function                         |
//|------------------------------------------------------------------|
int init()
  {

//---- indicators

   SetIndexStyle(0,DRAW_ARROW);
   SetIndexBuffer(0, ExtMapBuffer1);
   SetIndexArrow(0,Plot_Character);

   SetIndexStyle(1,DRAW_ARROW);
   SetIndexBuffer(1, ExtMapBuffer2);
   SetIndexArrow(1,Plot_Character);

   SetIndexStyle(2,DRAW_ARROW);
   SetIndexBuffer(2, ExtMapBuffer3);
   SetIndexArrow(2,224);

   if(MA_Period<2) MA_Period=13;

   return(0);
  }


//+------------------------------------------------------------------+
//| Custor indicator deinitialization function                       |
//+------------------------------------------------------------------+
int deinit()
  {
//---- TODO: add your code here

//----
   return(0);
  }


//+------------------------------------------------------------------+
//| Custom indicator iteration function                              |
//+------------------------------------------------------------------+
int start()
  {
     double sum=0;
     double oldsum=0;
     double change=0;

     int    i;
     int pos=Bars-ExtCountedBars-1;

//---- initial accumulation
   if(pos<MA_Period) pos=MA_Period;
   for(i=1;i<MA_Period;i++,pos--)
      sum+=Close[pos];


   if(Bars<=10) return(0);
   ExtCountedBars=IndicatorCounted();

//---- check for possible errors
   if (ExtCountedBars<0) return(-1);

//---- last counted bar will be recounted
   if (ExtCountedBars>0) ExtCountedBars--;


//---- main calculation loop
   while(pos>=0)
     {
      oldsum=sum;

      // add in the leading value to make MA_Period samples
      sum+=Close[pos];

      change=MathAbs(Close[pos]-Close[pos+6]);

      if(oldsum/(MA_Period-1) > sum/MA_Period)
         {
         ExtMapBuffer1[pos]=sum/MA_Period;
         ExtMapBuffer2[pos]=0;

         if (change>indChange)
            ExtMapBuffer3[pos]=sum/MA_Period;
         else
            ExtMapBuffer3[pos]=0;
         }
         else
         {
         ExtMapBuffer1[pos]=0;
         ExtMapBuffer2[pos]=sum/MA_Period;

         if (change>indChange)
            ExtMapBuffer3[pos]=sum/MA_Period;
         else
            ExtMapBuffer3[pos]=0;
         }

      // remove the trailing period to make MA_Period-1 samples
      sum-=Close[pos+MA_Period-1];
 	   pos--;
     }

//---- zero initial bars
   if(ExtCountedBars<1)
      {
      for(i=1;i<MA_Period;i++) ExtMapBuffer1[Bars-i]=0;
      for(i=1;i<MA_Period;i++) ExtMapBuffer2[Bars-i]=0;
      for(i=1;i<MA_Period;i++) ExtMapBuffer3[Bars-i]=0;
      }

   return(0);
  }

//+------------------------------------------------------------------+
Comments