Test2guns_v1
Download script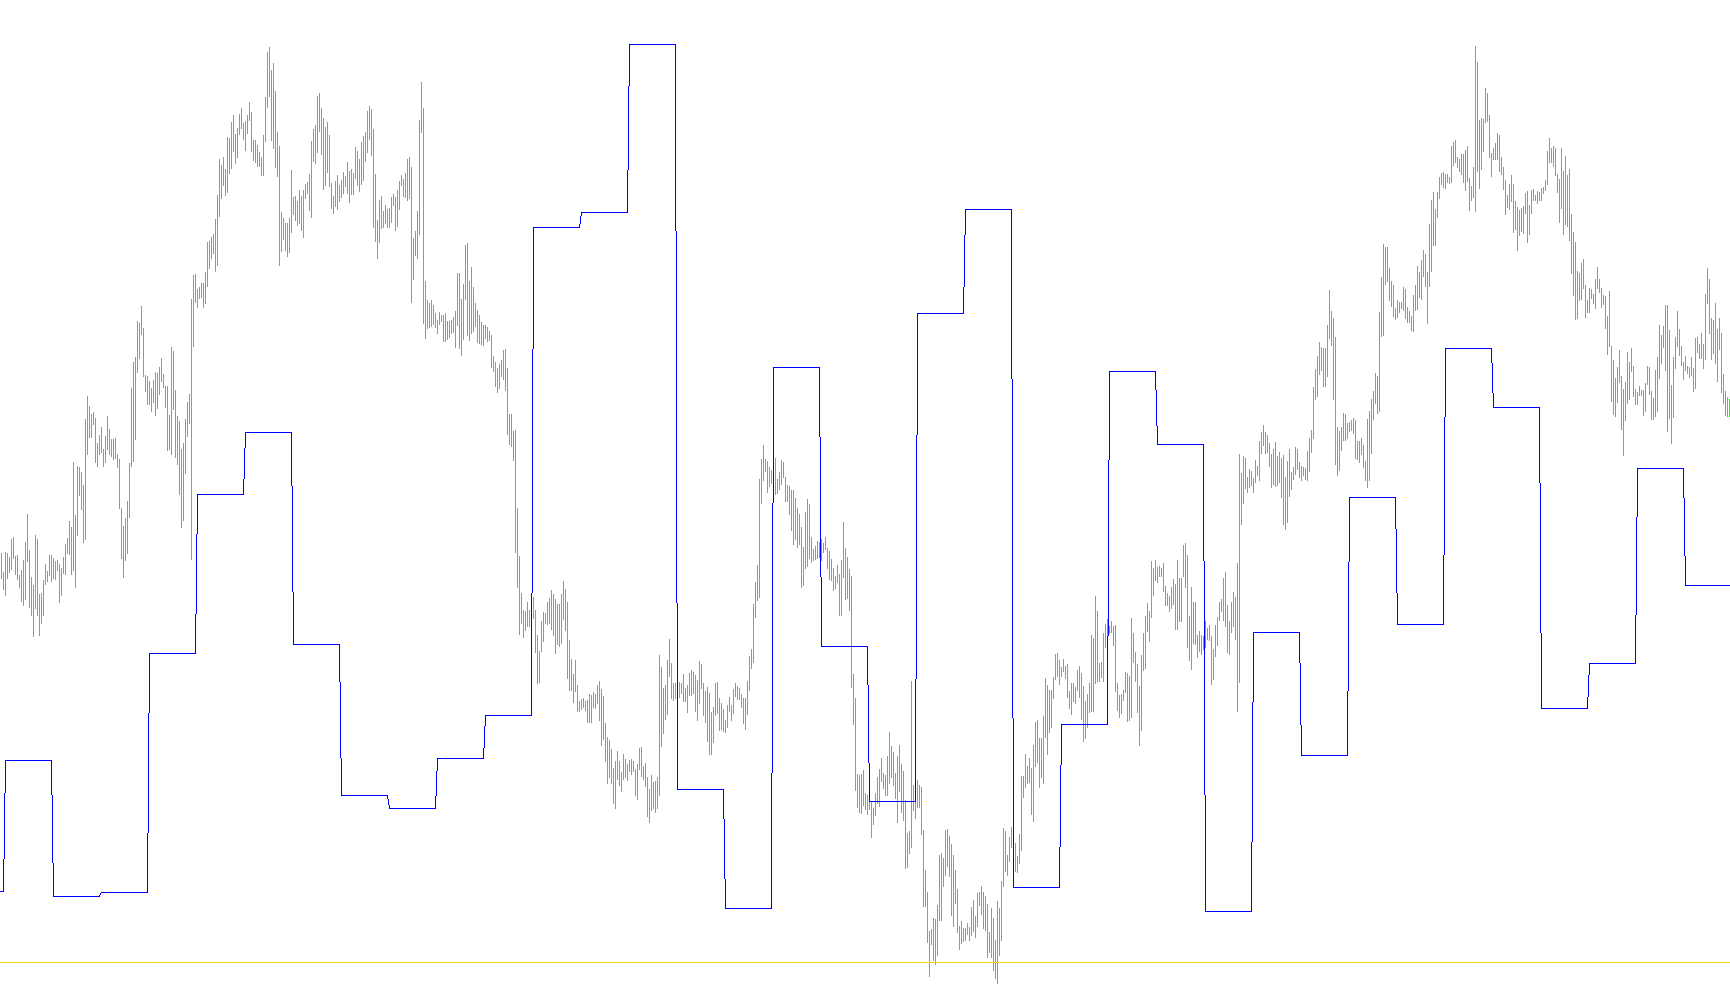
This tool is designed as a specialized visual aid for traders using the MetaTrader platform. Its primary purpose is to provide a high-level overview of market trends by consolidating and displaying data from larger timeframes onto your current trading chart.
How the Logic Works
Multi-Timeframe Data Integration The core functionality of this script is its ability to "look ahead" at broader time horizons. Instead of only showing you what is happening on the immediate price action (like a 1-minute or 5-minute chart), it pulls in information from much larger periods, specifically defined by the user's settings. This allows a trader to see the "big picture" without having to constantly switch between different tabs or windows.
Data Synchronization To make this data useful, the script performs a mathematical calculation to align the larger timeframe's movements with the current chart's timeline. It calculates a specific offset—essentially a bridge—that ensures the trends from the higher timeframe are mapped accurately over the smaller bars you are currently viewing.
Visual Representation The script identifies two distinct data streams, which it labels as "MRO1" and "MRO2." These are processed and rendered as two separate lines on a dedicated sub-window below your main price chart:
- Line 1 (Red): Represents the first set of calculated trend data.
- Line 2 (Yellow): Represents the second set of calculated trend data.
Summary for the Trader
By using this script, you are essentially viewing a "filtered" version of the market's long-term momentum. It simplifies your analysis by automatically fetching and plotting complex indicators from higher timeframes, allowing you to see if the broader market trend supports your current trading decisions at a single glance.
/*-----------------------------+
|			       |
| Shared by www.Aptrafx.com    |
|			       |
+------------------------------*/

//+------------------------------------------------------------------+
//|                                                         Test.mq4 |
//|                      Copyright © 2005, MetaQuotes Software Corp. |
//|                                        http://www.metaquotes.net |
//+------------------------------------------------------------------+
#property copyright "Rosh"
#property link      "http://forexsystems.ru/phpBB/"

#property indicator_separate_window
#property indicator_buffers 2
#property indicator_color1 Red
#property indicator_color2 Yellow
//---- input parameters
extern int       PeriodMin=1440;
//---- buffers
double ExtMapBuffer1[];
double ExtMapBuffer2[];
//+------------------------------------------------------------------+
//| Custom indicator initialization function                         |
//+------------------------------------------------------------------+
int init()
  {
//---- indicators
   SetIndexStyle(0,DRAW_LINE);
   SetIndexBuffer(0,ExtMapBuffer1);
   SetIndexStyle(1,DRAW_LINE);
   SetIndexBuffer(1,ExtMapBuffer2);
   SetIndexLabel(0,"MRO1");
   SetIndexLabel(1,"MRO2");
//----
   return(0);
  }
//+------------------------------------------------------------------+
//| Custor indicator deinitialization function                       |
//+------------------------------------------------------------------+
int deinit()
  {
//---- TODO: add your code here

//----
   return(0);
  }
//+------------------------------------------------------------------+
//| Custom indicator iteration function                              |
//+------------------------------------------------------------------+
int start()
  {
   int bigshift;
   int shift;
   int    counted_bars=IndicatorCounted();
//---- TODO: add your code here
   for (shift=Bars;shift>=0;shift--)
      {
      bigshift=MathFloor(shift*Period()/PeriodMin);
//      ExtMapBuffer1[shift]=iCustom(NULL,PeriodMin,"GATO",22,300,120,50,6,0,bigshift);
      ExtMapBuffer1[shift]=iCustom(NULL,PeriodMin,"MRO1",10,0,bigshift);
      ExtMapBuffer2[shift]=iCustom(NULL,PeriodMin,"MRO2",7,0,bigshift);
      }
//----
   return(0);
  }
//+------------------------------------------------------------------+
Comments