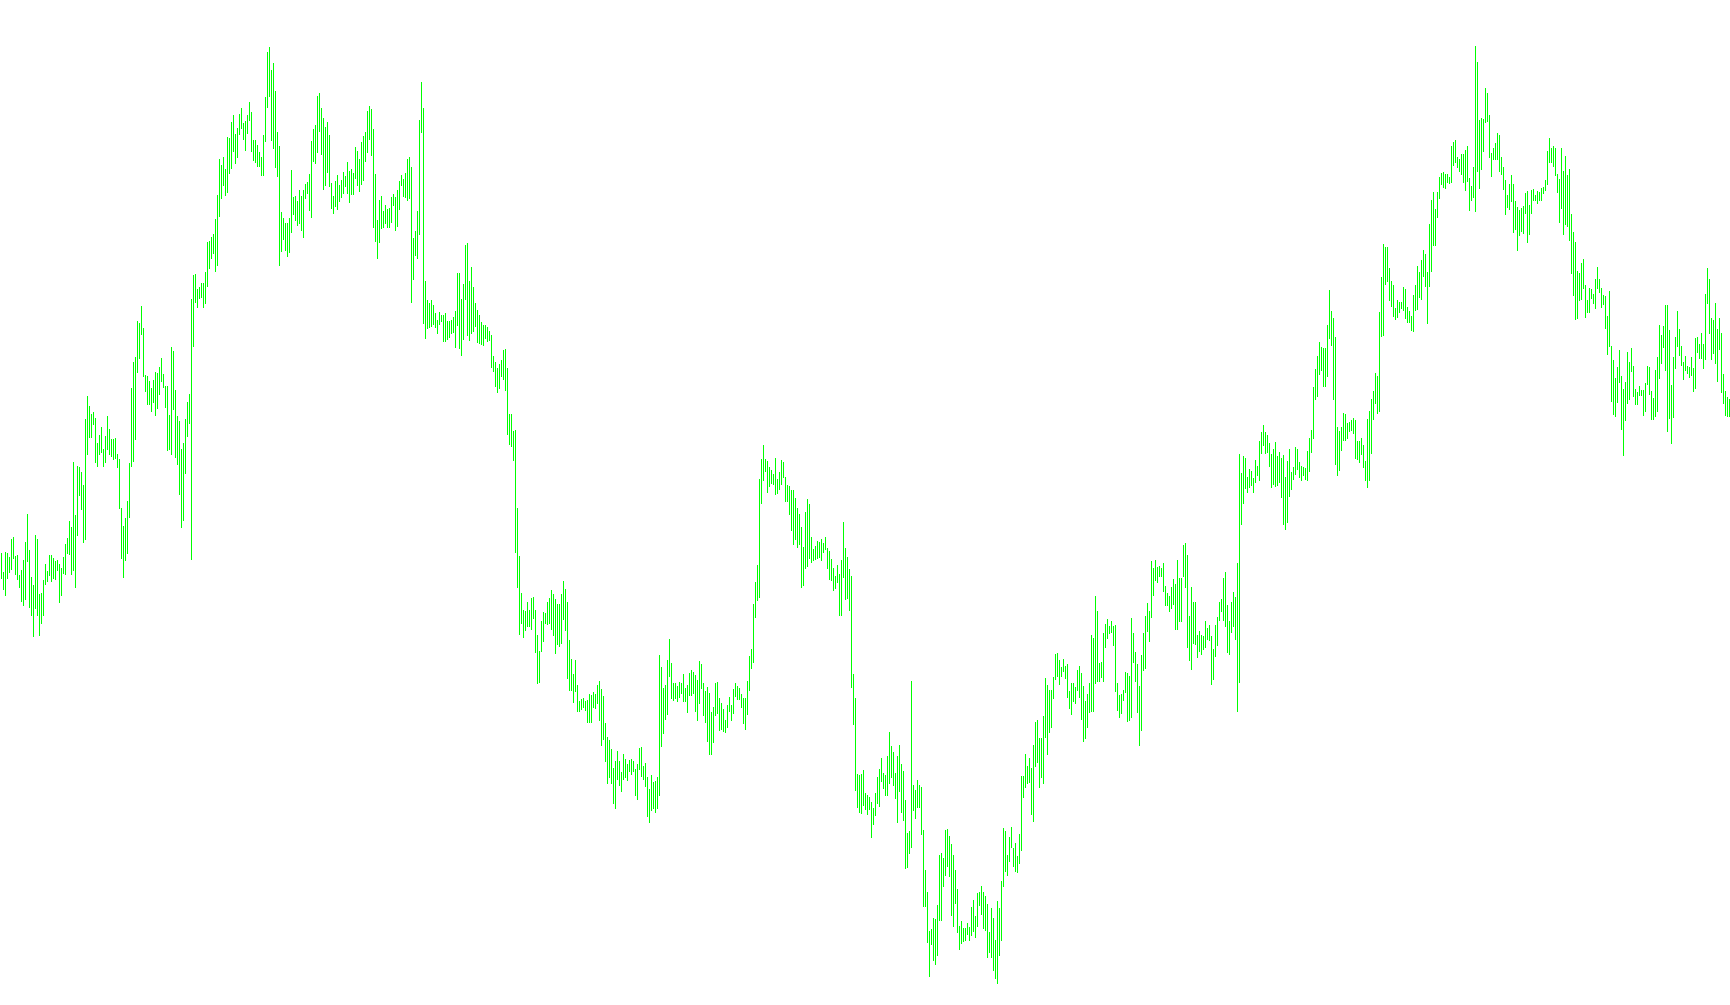
This tool is designed as a multi-currency visual indicator for the MetaTrader platform. Its primary purpose is to track and display the relative price movements of three specific currency pairs—GBPUSD, EURUSD, and USDCHF—simultaneously within a single dedicated window.
Core Functionality
The script operates by establishing a baseline "starting price" for each of the three currency pairs at the moment the indicator is loaded or refreshed. From that point forward, it calculates the price fluctuations for these assets in real-time. Instead of showing the absolute price (e.g., 1.2500), it tracks the "ticks" or the distance moved from that original starting point.
Key Features and Logic
- Relative Movement Tracking: By focusing on the change from a starting point rather than the current market price, the tool allows you to see how much each currency has gained or lost over a specific period. This makes it easier to compare the strength of different pairs side-by-side without being distracted by their different absolute values.
- Customized Calculations: The logic includes specific adjustments for different currency behaviors. For example, it applies a negative multiplier to the USDCHF movements, likely to align its visual direction with the other pairs for easier trend identification.
- Dynamic Averaging: The script calculates an average value based on the collective movement of all three currency pairs. This "average" serves as a benchmark to help determine the overall market sentiment or the combined momentum of the group.
- Visual Boundaries: The indicator includes a "Chart Limit" feature. It uses the calculated average and the highest/lowest points reached during the tracking period to create visual boundaries. These boundaries help the user identify if the current market movement is approaching extreme highs or lows relative to recent history.
- Compatibility Modes: The script includes a specific toggle for different types of trading accounts (such as "Mini" accounts), ensuring that the naming conventions for the currency pairs remain accurate depending on which broker's data is being used.
User Experience
For a trader, this tool provides a centralized view of correlated markets. By visualizing these movements together, it simplifies the process of identifying which currencies are leading the market and which are lagging, while providing a clear sense of the "average" trend across all three assets simultaneously.
//+--------------------------------------------------------------------------------------
//    10/11/2007 - Modified to work with IBFX mini accounts and dropped USDJPY references
//    10/11/2007 - Corrected local/global variable usage in init() and initialization of tik & t

#property indicator_separate_window
#property indicator_buffers 4
#property indicator_color1 Green //gbpusd
#property indicator_color2 Red //chart limits
#property indicator_color3 White //eurusd
#property indicator_color4 Yellow //usdchf

extern int  period=200;
extern bool IBFXMiniAcct=true;

double      ExtMapBuffer1[],ExtMapBuffer2[],ExtMapBuffer3[],ExtMapBuffer4[];
int         tik=0,t=0;
double      bufGU[],MaxB,MinB=1000, bufEU[],bufUCH[];
double      startpricegbpusd,startpriceeurusd,startpriceusdchf;
double      avgvalue;
string      eurusd="EURUSD",gbpusd="GBPUSD",usdchf="USDCHF";

//+------------------------------------------------------------------+
int init()
  {
   SetIndexStyle(0,DRAW_SECTION);
   SetIndexBuffer(0,ExtMapBuffer1);
   SetIndexLabel(0,"GBPUSD Tick");
   SetIndexStyle(1,DRAW_NONE);
   SetIndexBuffer(1,ExtMapBuffer2);
   SetIndexLabel(1,"Chart Limit");
   SetIndexStyle(2,DRAW_SECTION);
   SetIndexBuffer(2,ExtMapBuffer3);
   SetIndexLabel(2,"EURUSD Tick");
   SetIndexStyle(3,DRAW_SECTION);
   SetIndexBuffer(3,ExtMapBuffer4);
   SetIndexLabel(3,"USDCHF Tick");

   if(IBFXMiniAcct)
      {
      eurusd="EURUSDm";
      gbpusd="GBPUSDm";
      usdchf="USDCHFm";
      }
   startpricegbpusd=MarketInfo(gbpusd,MODE_BID);
   startpriceeurusd=MarketInfo(eurusd,MODE_BID);
   startpriceusdchf=MarketInfo(usdchf,MODE_BID);
   return(0);
  }

//+------------------------------------------------------------------+
int start()
  {
   int i,b;
   double bidgbpusd=MarketInfo(gbpusd,MODE_BID);
   double pointgbpusd=MarketInfo(gbpusd,MODE_POINT);
   double bideurusd=MarketInfo(eurusd,MODE_BID);
   double pointeurusd=MarketInfo(eurusd,MODE_POINT);
   double bidusdchf=MarketInfo(usdchf,MODE_BID);
   double pointusdchf=MarketInfo(usdchf,MODE_POINT);
   t++;
   b=period;
   ArrayResize(bufGU,b);
   ArrayResize(bufEU,b);
   ArrayResize(bufUCH,b);
   if(tik==0)
      {
      for(i=0;i<b;i++)
         {
         bufGU[i]=0;
         startpricegbpusd=bidgbpusd;
         bufEU[i]=0;
         startpriceeurusd=bideurusd;
         bufUCH[i]=0;
         startpriceusdchf=bidusdchf;
         }
      ExtMapBuffer2[0]=+5;
      ExtMapBuffer2[1]=-5;
      tik=1;
      }
   MaxB=-1;MinB=1000;
   for(i=b-1;i>0;i--)
      {
      bufGU[i]=bufGU[i-1];
      if(MaxB<bufGU[i])MaxB=bufGU[i];
      if(MinB>bufGU[i])MinB=bufGU[i];
      bufEU[i]=bufEU[i-1];
      if(MaxB<bufEU[i])MaxB=bufEU[i];
      if(MinB>bufEU[i])MinB=bufEU[i];
      bufUCH[i]=bufUCH[i-1];
      if(MaxB<bufUCH[i])MaxB=bufUCH[i];
      if(MinB>bufUCH[i])MinB=bufUCH[i];
      }
   bufGU[0]=(bidgbpusd-startpricegbpusd)/pointgbpusd;
   bufEU[0]=(bideurusd-startpriceeurusd)/pointeurusd;
   bufUCH[0]=(bidusdchf-startpriceusdchf)/pointusdchf* (-1);
   for(i=0;i<b;i++)
      {
      ExtMapBuffer1[i]=bufGU[i];
      ExtMapBuffer3[i]=bufEU[i];
      ExtMapBuffer4[i]=bufUCH[i];
      }
   if(MathCeil(t/10)*10==t)
      {
      for(i=b;i<Bars;i++)
         {
         ExtMapBuffer1[i]=(bidgbpusd-startpricegbpusd)/pointgbpusd;
         ExtMapBuffer3[i]=(bideurusd-startpriceeurusd)/pointeurusd;
         ExtMapBuffer4[i]=(bidusdchf-startpriceusdchf)/pointusdchf* (-1);
         avgvalue=(
               ((bidgbpusd-startpricegbpusd)/pointgbpusd)+
               ((bideurusd-startpriceeurusd)/pointeurusd)+
               (((bidusdchf-startpriceusdchf)/pointusdchf)* (-1))
               ) /4;
         }
      ArrayInitialize(ExtMapBuffer2,avgvalue);
      if(MaxB-avgvalue<5)ExtMapBuffer2[0]=avgvalue+5;
      if( (avgvalue-MinB)<5)ExtMapBuffer2[1]=(avgvalue)-5;
      }
   return(0);
   }
//+------------------------------------------------------------------+
Comments