Ticker SATL_v1
Download script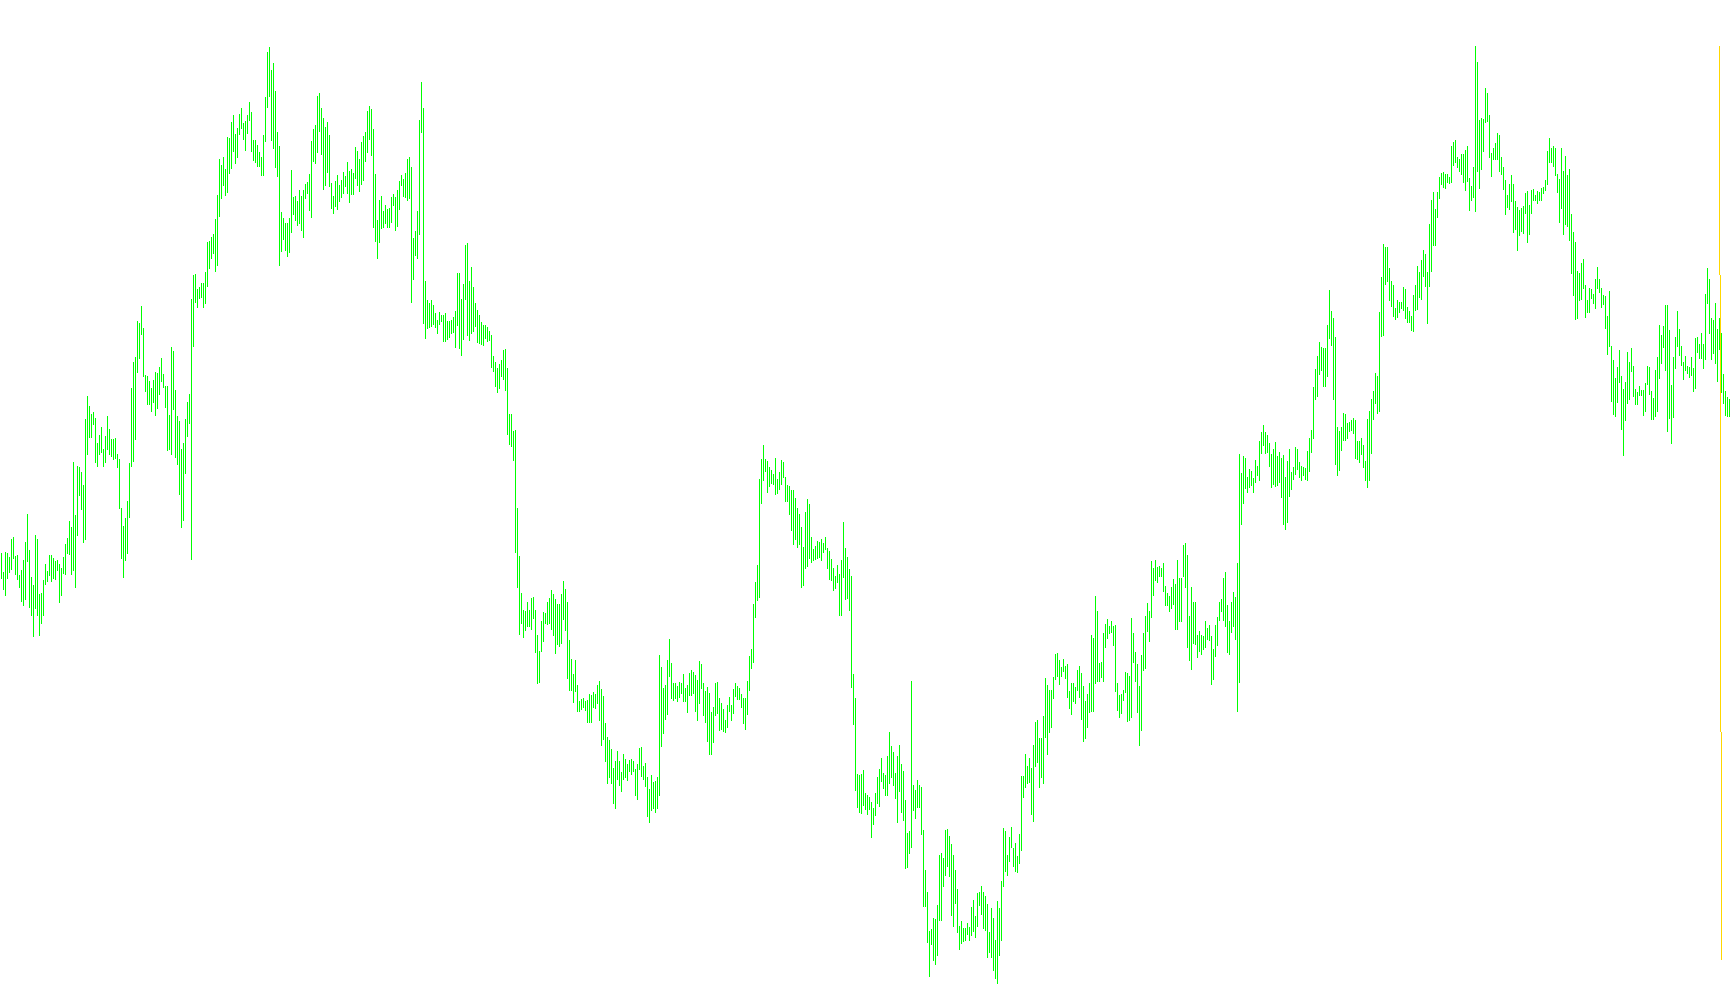
This script is a custom technical indicator designed for the MetaTrader platform to track and visualize specific price behaviors. It operates by monitoring live market data and transforming it into two distinct visual components on a separate window of your chart.
Core Functionality
1. Data Tracking (The Ticker) The tool keeps a running history of the asset's price movements. Every time the market price changes, the script captures that new value and organizes it into a chronological sequence. It stores these values in a dedicated "Ticker" list, ensuring that the most recent prices are always available for calculation while older data is preserved in the background.
2. Weighted Calculation (The SATL) The primary purpose of this script is to perform a complex mathematical calculation known as "SATL." Instead of looking at just the current price, the script analyzes a window of the last 64 price points.
It applies a specific weight (a unique multiplier) to each of these 64 prices. Some weights are positive, while others are negative. This means the script is essentially calculating a "weighted average" where different historical moments have different levels of influence on the final result:
- Recent prices may have higher significance.
- Specific historical gaps may be subtracted or adjusted based on their relative position in the sequence.
- The final sum of all these weighted components creates the "SATL" value.
3. Visual Output The script provides two visual lines for the user to observe:
- Ticker Line: Represents the raw movement of the price data collected by the tool.
- SATL Line: Represents the calculated result of the complex weighted formula.
Operational Behavior
- Dynamic Updates: The indicator only refreshes its calculations when a new price change is detected, ensuring it stays synchronized with live market action.
- Initialization Phase: The script requires a small amount of data (at least 64 price points) to "prime" the calculation. Until this threshold is met, the SATL value remains empty.
- Continuous Monitoring: Once the required data is gathered, the script continuously updates both lines in real-time, allowing traders to observe the relationship between raw price movement and the weighted SATL output.
//+------------------------------------------------------------------+
//|                                                                  |
//|                 Ticker SATL.mq4.                                 |
//|                                                                  |
//+------------------------------------------------------------------+
#property copyright "mandorr@gmail.com"
#property indicator_separate_window
#property indicator_buffers 2
//----
#property indicator_color1 Red
#property indicator_width1 1
#property indicator_style1 0
//----
#property indicator_color2 Red
#property indicator_width2 2
#property indicator_style2 0
//----
extern int CountBars=1000;   // Êîëè÷åñòâî îòîáðàæàåìûõ áàðîâ
//----
int count;
int price;
int price_prev;
//----
double ticker[100];           // áóôåð òèêîâ
double SATL[100];             // áóôåð SATL
double buffer0[];
double buffer1[];
//+------------------------------------------------------------------+
//|                                                                  |
//+------------------------------------------------------------------+
void init()
  {
   SetIndexBuffer(0,buffer0);
   SetIndexLabel(0,"Ticker");
   SetIndexDrawBegin(0,0);
//----
   SetIndexBuffer(1,buffer1);
   SetIndexLabel(1,"SATL");
   SetIndexDrawBegin(1,0);
//----
   count=ArrayResize(ticker,CountBars);
   count=ArrayResize(SATL,CountBars);
   count=0;
   ArrayInitialize(SATL,EMPTY_VALUE); // EMPTY_VALUE=+2147483647
   price_prev=0;
  }
//+------------------------------------------------------------------+
//|                                                                  |
//+------------------------------------------------------------------+
void start()
  {
   int i, j;
   double sum, value;
   price=MathRound(Bid/Point);
   if (price_prev==0)
     {
      count=0;
      price_prev=price;
      ticker[0]=price*Point;
      buffer0[0]=ticker[0];
      IndicatorShortName("Ticker ("+count+") SATL");
      return;
     }
   if (price==price_prev) return;
   price_prev=price;
   for(i=count; i>=0; i--)
     {
      ticker[i+1]=ticker[i];
      SATL[i+1]=SATL[i];
     }
   ticker[0]=price*Point;
   if (count<CountBars-1) count++;
   if (count>=64)
      SATL[0]=0
      +0.0982862174*ticker[0]
      +0.0975682269*ticker[1]
      +0.0961401078*ticker[2]
      +0.0940230544*ticker[3]
      +0.0912437090*ticker[4]
      +0.0878391006*ticker[5]
      +0.0838544303*ticker[6]
      +0.0793406350*ticker[7]
      +0.0743569346*ticker[8]
      +0.0689666682*ticker[9]
      +0.0632381578*ticker[10]
      +0.0572428925*ticker[11]
      +0.0510534242*ticker[12]
      +0.0447468229*ticker[13]
      +0.0383959950*ticker[14]
      +0.0320735368*ticker[15]
      +0.0258537721*ticker[16]
      +0.0198005183*ticker[17]
      +0.0139807863*ticker[18]
      +0.0084512448*ticker[19]
      +0.0032639979*ticker[20]
      -0.0015350359*ticker[21]
      -0.0059060082*ticker[22]
      -0.0098190256*ticker[23]
      -0.0132507215*ticker[24]
      -0.0161875265*ticker[25]
      -0.0186164872*ticker[26]
      -0.0205446727*ticker[27]
      -0.0219739146*ticker[28]
      -0.0229204861*ticker[29]
      -0.0234080863*ticker[30]
      -0.0234566315*ticker[31]
      -0.0231017777*ticker[32]
      -0.0223796900*ticker[33]
      -0.0213300463*ticker[34]
      -0.0199924534*ticker[35]
      -0.0184126992*ticker[36]
      -0.0166377699*ticker[37]
      -0.0147139428*ticker[38]
      -0.0126796776*ticker[39]
      -0.0105938331*ticker[40]
      -0.0084736770*ticker[41]
      -0.0063841850*ticker[42]
      -0.0043466731*ticker[43]
      -0.0023956944*ticker[44]
      -0.0005535180*ticker[45]
      +0.0011421469*ticker[46]
      +0.0026845693*ticker[47]
      +0.0040471369*ticker[48]
      +0.0052380201*ticker[49]
      +0.0062194591*ticker[50]
      +0.0070340085*ticker[51]
      +0.0076266453*ticker[52]
      +0.0080376628*ticker[53]
      +0.0083037666*ticker[54]
      +0.0083694798*ticker[55]
      +0.0082901022*ticker[56]
      +0.0080741359*ticker[57]
      +0.0077543820*ticker[58]
      +0.0073260526*ticker[59]
      +0.0068163569*ticker[60]
      +0.0062325477*ticker[61]
      +0.0056078229*ticker[62]
      +0.0049516078*ticker[63]
      +0.0161380976*ticker[64];
   for(i=0; i<=count; i++)
     {
      buffer0[i]=ticker[i];
      buffer1[i]=SATL[i];
     }
   IndicatorShortName("Ticker ("+count+") SATL");
  }
//+------------------------------------------------------------------+
Comments