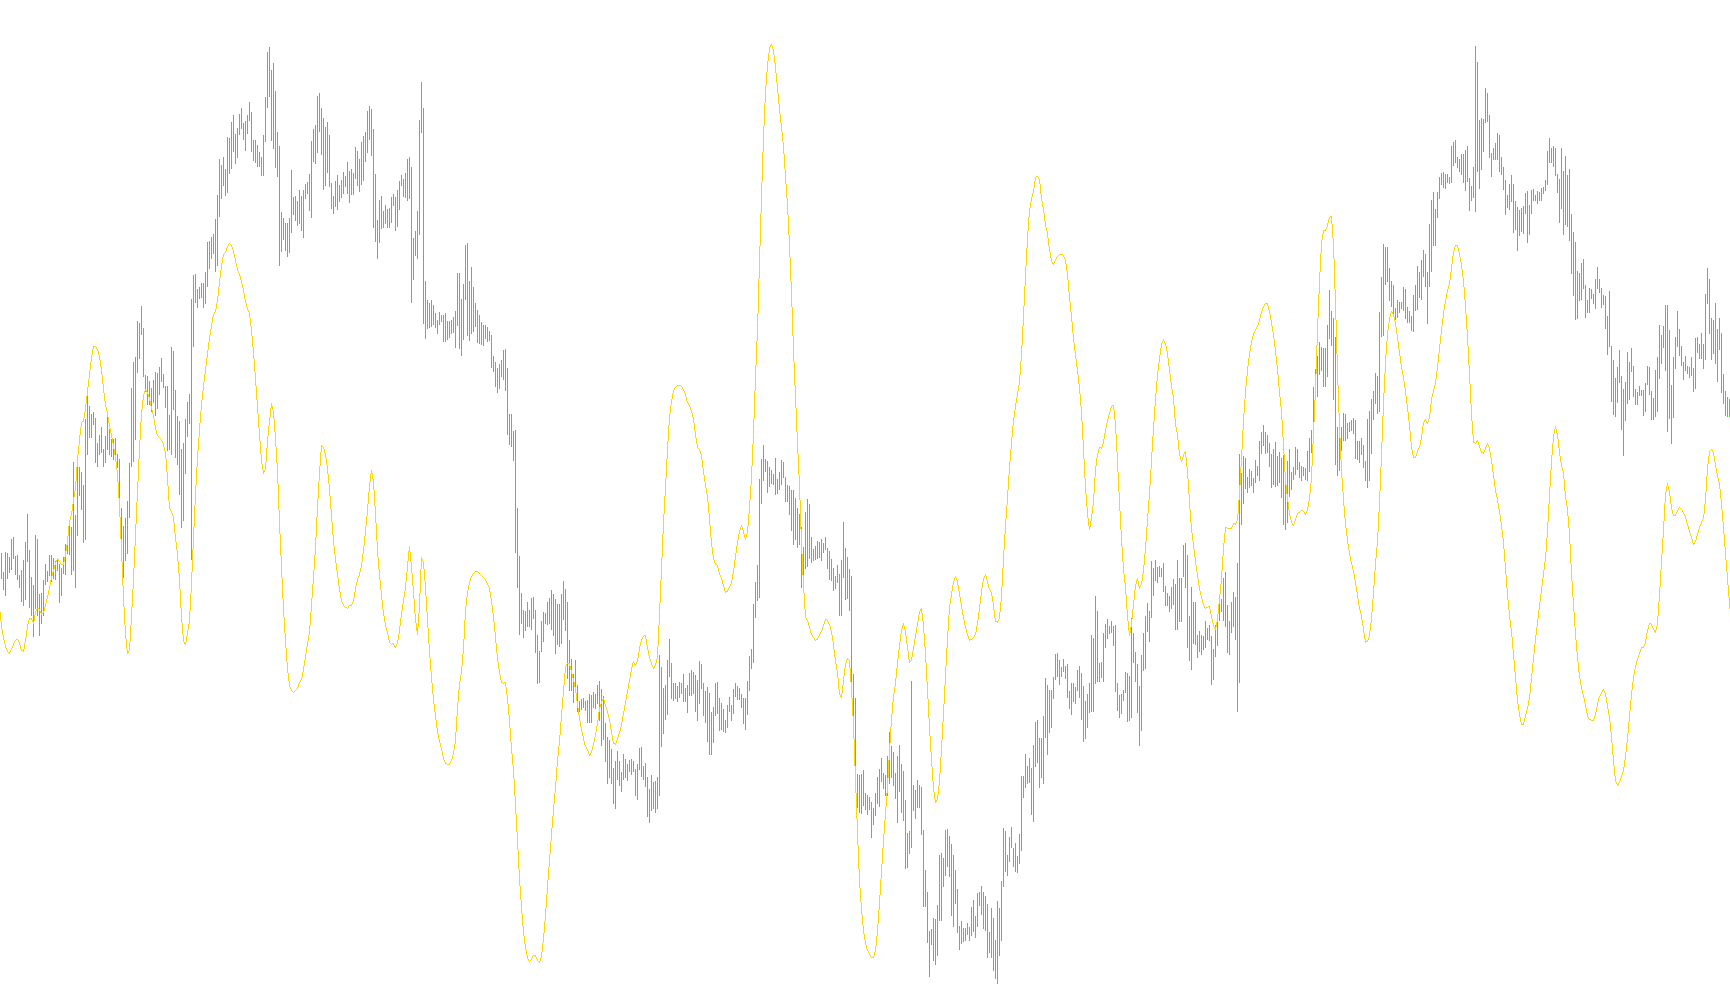
The Ticks Volume Indicator (TVI) is a sophisticated technical analysis tool designed to measure the intensity and direction of market activity by analyzing "ticks"—the smallest increments of price movement. Unlike standard volume indicators that may only show how much was traded, this script attempts to distinguish between buying pressure and selling pressure to provide a clearer picture of market momentum.
Core Logic Breakdown
1. Identifying Market Pressure The tool begins by splitting the total volume of each price candle into two distinct components: upward pressure and downward pressure. It calculates these by looking at the relationship between the opening and closing prices relative to the total volume. By doing this, the indicator can estimate how much of the volume was driven by aggressive buying versus aggressive selling.
2. Smoothing the Data (First Layer) Raw market data is often "noisy" and erratic. To make the information readable for a trader, the script applies an Exponential Moving Average (EMA) to both the upward and downward tick values. This smoothing process removes minor price fluctuations, allowing the user to see the underlying trend of the buying and selling forces more clearly.
3. Trend Refinement (Second Layer) The script then performs a secondary layer of smoothing on those averages. By applying a second moving average to the first set of smoothed results, it filters out even more "market noise." This ensures that the resulting data represents sustained trends rather than momentary spikes in activity.
4. The Final Calculation After calculating the refined upward and downward forces, the indicator converts these values into a percentage-based scale. It measures the difference between the buying pressure and selling pressure against their total sum. Finally, it applies one last smoothing pass to create a clean, fluid line.
How to Interpret the Results
The final output is a single line displayed in a separate window on your chart. Because the logic is based on the balance between buyers and sellers:
- Positive Movement: Indicates that buying pressure is outweighing selling pressure (bullish sentiment).
- Negative Movement: Indicates that selling pressure is dominant over buying pressure (bearish sentiment).
- The Line’s Path: Because of the multiple layers of smoothing, the line provides a "weighted" view of momentum, helping traders identify when a trend is gaining strength or beginning to lose steam.
//+------------------------------------------------------------------+
//|                                           Ticks Volume Indicator |
//|                                         Copyright © William Blau |
//|                                    Coded/Verified by Profitrader |
//+------------------------------------------------------------------+
#property copyright "Copyright © 2006, Profitrader."
#property link      "profitrader@inbox.ru"
//-----
#property indicator_separate_window
#property indicator_buffers 1
#property indicator_color1 Red
//---- input parameters
extern int r=12;
extern int s=12;
extern int u=5;
//---- buffers
double TVI[];
double UpTicks[];
double DownTicks[];
double EMA_UpTicks[];
double EMA_DownTicks[];
double DEMA_UpTicks[];
double DEMA_DownTicks[];
double TVI_calculate[];
//+------------------------------------------------------------------+
//| Custom indicator initialization function                         |
//+------------------------------------------------------------------+
int init()
  {
   IndicatorShortName("TVI("+r+","+s+","+u+")");
   IndicatorBuffers(8);
   SetIndexBuffer(0,TVI);
   SetIndexBuffer(1,UpTicks);
   SetIndexBuffer(2,DownTicks);
   SetIndexBuffer(3,EMA_UpTicks);
   SetIndexBuffer(4,EMA_DownTicks);
   SetIndexBuffer(5,DEMA_UpTicks);
   SetIndexBuffer(6,DEMA_DownTicks);
   SetIndexBuffer(7,TVI_calculate);
   SetIndexStyle(0,DRAW_LINE);
   SetIndexLabel(0,"TVI");
   return(0);
  }
//+------------------------------------------------------------------+
//| Custom indicator deinitialization function                       |
//+------------------------------------------------------------------+
int deinit()
  {
   return(0);
  }
//+------------------------------------------------------------------+
//| Ticks Volume Indicator                                           |
//+------------------------------------------------------------------+
int start()
  {
   int i,counted_bars=IndicatorCounted();
//---- check for possible errors
   if(counted_bars<0) return(-1);
//---- last counted bar will be recounted
   if(counted_bars>0) counted_bars--;
   int limit=Bars-counted_bars;
//----
   for(i=0; i<limit; i++)
     {
      UpTicks[i]=(Volume[i]+(Close[i]-Open[i])/Point)/2;
      DownTicks[i]=Volume[i]-UpTicks[i];
     }
   for(i=limit-1; i>=0; i--)
     {
      EMA_UpTicks[i]=iMAOnArray(UpTicks,0,r,0,MODE_EMA,i);
      EMA_DownTicks[i]=iMAOnArray(DownTicks,0,r,0,MODE_EMA,i);
     }
   for(i=limit-1; i>=0; i--)
     {
      DEMA_UpTicks[i]=iMAOnArray(EMA_UpTicks,0,s,0,MODE_EMA,i);
      DEMA_DownTicks[i]=iMAOnArray(EMA_DownTicks,0,s,0,MODE_EMA,i);
     }
   for(i=0; i<limit; i++)
      TVI_calculate[i]=100.0*(DEMA_UpTicks[i]-DEMA_DownTicks[i])/(DEMA_UpTicks[i]+DEMA_DownTicks[i]);
   for(i=limit-1; i>=0; i--)
      TVI[i]=iMAOnArray(TVI_calculate,0,u,0,MODE_EMA,i);
//----
   return(0);
  }
//+------------------------------------------------------------------+
Comments