Time Series Forecast
Download script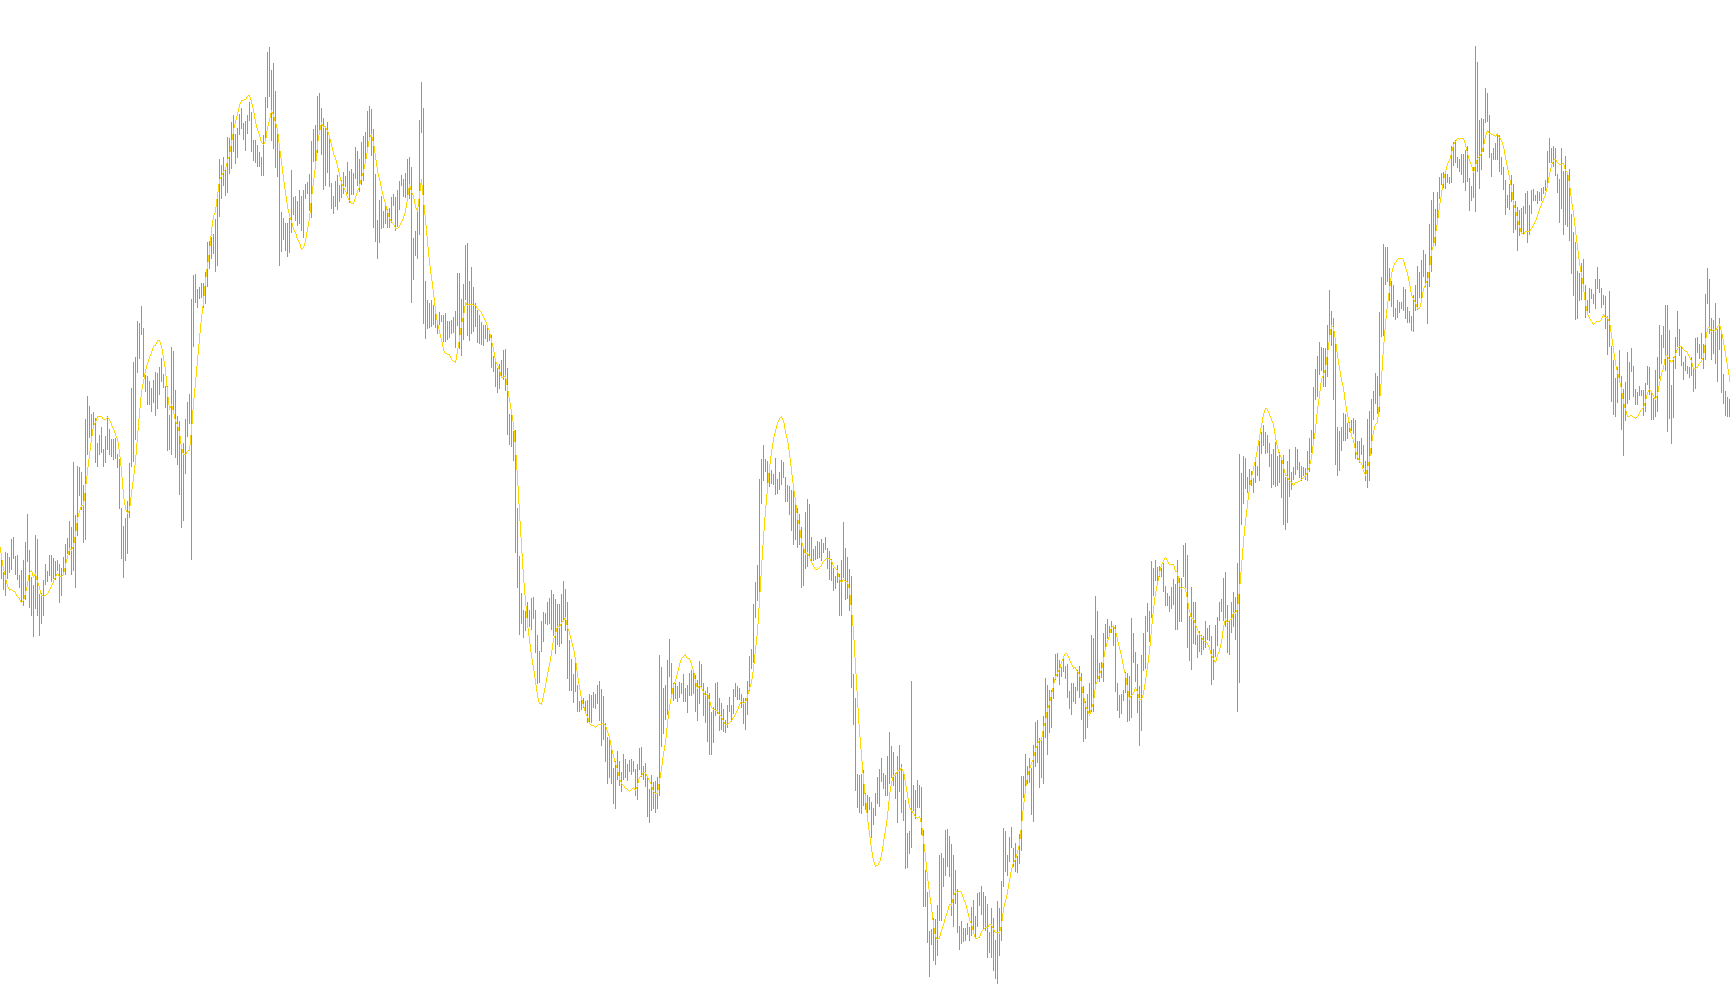
This Time Series Forecast tool is designed to provide traders with a visual representation of potential price direction by analyzing historical trends. Instead of just looking at where the price has been, this script attempts to project where the price might head based on a specific window of recent activity.
How the Logic Works
The core functionality of this script relies on Linear Regression analysis. In simple terms, imagine taking a series of dots on a graph (representing past closing prices) and trying to draw a perfectly straight line through them that best captures the overall "flow" of those dots.
Here is the step-by-step breakdown of how the tool processes your data:
- The Lookback Window: The user can define a specific period (the default is 20 bars). The script focuses exclusively on this amount of historical data to determine the current trend.
- Data Collection: For every point on your chart, the script looks back at the closing prices over that designated period. It collects these values to calculate the "momentum" and "position" of the price movement.
- Mathematical Modeling: The script performs a series of calculations to find two key components:
- The Slope: This identifies if the price is generally moving up, down, or staying flat over that period.
- The Intercept: This establishes the starting point of that movement.
- The Forecast Projection: By combining the slope and the intercept, the script calculates a "forecast value." This value represents what the price should be at the current moment if it continued moving in exactly the same straight-line pattern established by the past 20 bars.
Visual Representation
On your trading chart, this logic manifests as a red line. This line acts as a mathematical "trend path." By watching how the actual market price moves in relation to this forecasted line, traders can better visualize whether the current momentum is holding steady, accelerating, or deviating from the established trend.
Summary for the User
Think of this tool as a "Path Predictor." It doesn't guess random future prices; rather, it looks at the trail left behind by the market and draws a straight line forward to show you where that trail is currently heading. It helps filter out minor "noise" in price fluctuations to show you the broader underlying direction of the trend.
//+------------------------------------------------------------------+
//|                                         Time Series Forecast.mq4 |
//|                      Copyright © 2006, MetaQuotes Software Corp. |
//|                                        http://www.metaquotes.net |
//+------------------------------------------------------------------+
#property copyright "Copyright © 2006, MetaQuotes Software Corp."
#property link      "http://www.metaquotes.net"

#property indicator_chart_window
#property indicator_buffers 1
#property indicator_color1 Red
//---- input parameters
extern int TSFPeriod = 20;
//---- buffers
double ExtMapBuffer1[];
//+------------------------------------------------------------------+
//| Custom indicator initialization function                         |
//+------------------------------------------------------------------+
int init()
  {
//---- indicators
   SetIndexStyle(0,DRAW_LINE);
   SetIndexBuffer(0,ExtMapBuffer1);
//----
   return(0);
  }
//+------------------------------------------------------------------+
//| Custom indicator deinitialization function                       |
//+------------------------------------------------------------------+
int deinit()
  {
//----

//----
   return(0);
  }
//+------------------------------------------------------------------+
//| Custom indicator iteration function                              |
//+------------------------------------------------------------------+
int start()
  {
   int    counted_bars=IndicatorCounted();
//----
   double ka,kb,sx,sy,sxy,sx2,ival;
   int cnt;

   int i,limit;

     limit=Bars-TSFPeriod-counted_bars;
  //---- main loop
     for(i=limit; i>=0; i--)

   {
	sy=0;
	sx=0;
	sxy=0;
	sx2=0;
	for (cnt=1; cnt<= TSFPeriod; cnt++)
	{
		sy+=Close[i+cnt-1];
		sx+=cnt;
		sx2+=cnt*cnt;
		sxy+=Close[i+cnt-1]*cnt;
	}
	kb=(TSFPeriod*sxy-sx*sy)/(TSFPeriod*sx2-sx*sx);
	ka=(sy-kb*sx)/TSFPeriod;
	ival=ka+kb;
	ExtMapBuffer1[i] = ival;
}

//----
   return(0);
  }
//+------------------------------------------------------------------+
/*
extern int ndot=21;


bool is_First=true;

SetLoopCount(0);

// Check for additional bars loading or total reloadng.
If Bars<prevbars or Bars-prevbars>1 Then is_First=True;
prevbars=Bars;
//--------------------------------------------------------

// Pre-Loop setup
// loopbegin prevents counting of previously plotted bars excluding current Bars
if is_First Then Begin
   LoopBegin=bars-ndot-2;
   is_First=False;
End;
//--------------------------------------------------------

loopBegin++; // Plot the current bar also
// loop from first bar to current bar (with shift=0)
For shift=loopBegin Downto 0 Begin
	sy=0;
	sx=0;
	sxy=0;
	sx2=0;
	For cnt=1 To ndot Begin
		sy+=close[shift+cnt-1];
		sx+=cnt;
		sx2+=cnt*cnt;
		sxy+=close[shift+cnt-1]*cnt;
	End;
	kb=(ndot*sxy-sx*sy)/(ndot*sx2-sx*sx);
	ka=(sy-kb*sx)/ndot;
	ival=ka+kb;
	SetIndexValue(shift, ival);
	loopBegin--;   // Prevent repeating previously plotted bars on next tick
End
*/
Comments