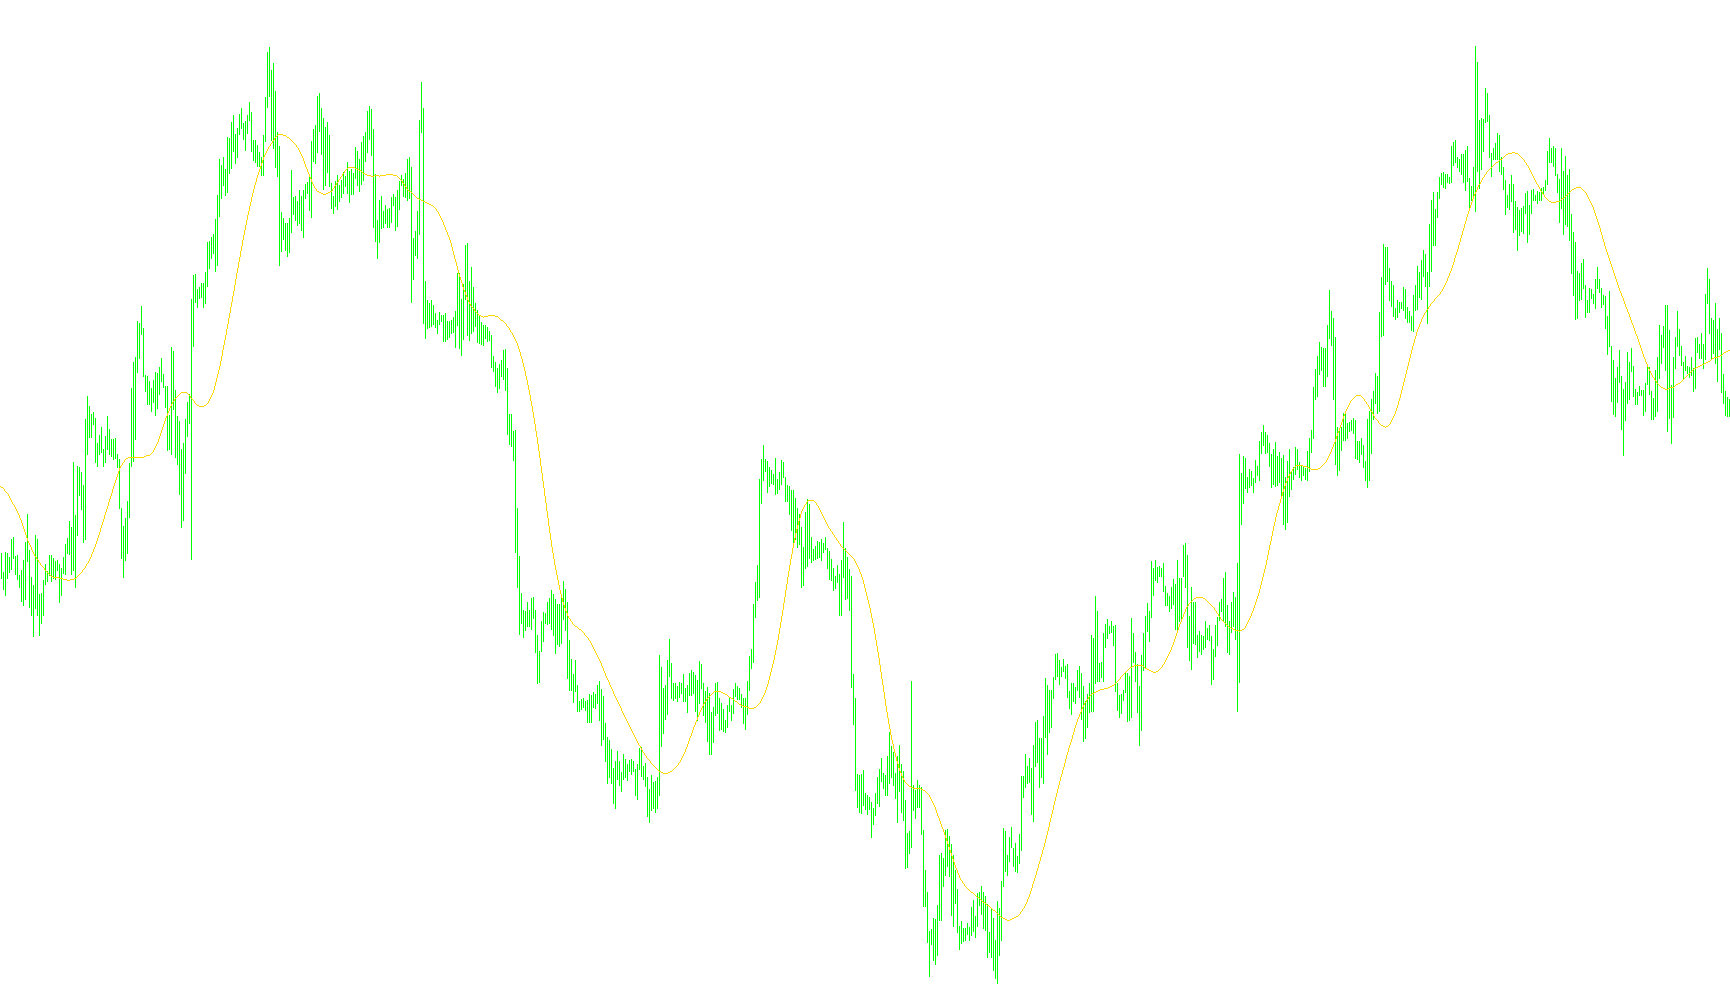
This tool is designed as a technical indicator for trading platforms to help visualize market trends by calculating a specialized type of moving average. Unlike standard averages that treat every piece of data with equal importance, this script utilizes a weighted logic to provide a more nuanced view of price action over a specific period of time.
How the Logic Works
1. Dynamic Weighting System The core functionality of this indicator lies in how it prioritizes historical data. Instead of giving the same "weight" to every price point in the look-back period, the script applies a linear weighting system. It assigns higher importance to the most recent price data and progressively lower importance to older data as it moves further back into the past. This ensures that the resulting line on your chart reacts more significantly to current market movements while still accounting for historical context.
2. Balanced Distribution The script organizes these weights in a symmetrical fashion. By increasing the weight toward the center of the calculation period and decreasing it toward the edges, it creates a balanced "curved" importance. This helps smooth out sudden market "noise" or erratic price spikes that might otherwise cause a standard moving average to jump around too aggressively.
3. Custom Price Input Options One of the key features of this logic is its flexibility in choosing which data point to analyze. Rather than being locked into only looking at the closing price, the script allows users to choose from several different market metrics, including:
- Open: The price at the start of a period.
- High/Low: The extremes reached during a period.
- Median: The midpoint between the high and low.
- Typical/Weighted Prices: Mathematical averages that combine the high, low, and closing prices in different proportions.
4. Continuous Calculation The script automatically scans through your historical chart data to perform these weighted calculations. It constantly updates the "divisor"—a mathematical total of all weights used—to ensure that the final line shown on the chart is always accurately scaled to the specific number of periods you have chosen. This provides a fluid, green trend line that helps traders identify the prevailing momentum of the market at a glance.
//+------------------------------------------------------------------+
//|                                                          TMA.mq4 |
//|                                                     Matias Romeo |
//|                                    mailto:matias.romeo@gmail.com |
//+------------------------------------------------------------------+
#property copyright "Matias Romeo"
#property link      "mailto:matias.romeo@gmail.com"
//----
#property indicator_chart_window
#property indicator_buffers 1
#property indicator_color1 Green
//Input parameters
extern int       Periods=30;
extern int       ApplyTo=0;
//Indicator buffers
double tma[];
//Global variables
int    weights[];
double divisor;
//+------------------------------------------------------------------+
//|                                                                  |
//+------------------------------------------------------------------+
int init()
  {
   SetIndexStyle(0,DRAW_LINE);
   SetIndexBuffer(0,tma);
//----
   IndicatorShortName( "TMA(" + Periods + ")" );
   //Calculate weigths
   ArrayResize(weights,Periods);
   double dPeriods=Periods;
   int to=MathCeil(dPeriods/2.0);
//----
   for(int i=0; i<to; i++)
     {
      weights[i]           =i+1;
      weights[Periods-1-i] =i+1;
     }
   divisor=0.0;
   for(int j=0; j<Periods; j++)
      divisor+=weights[j];
   return(0);
  }
//+------------------------------------------------------------------+
//|                                                                  |
//+------------------------------------------------------------------+
int deinit()
  {
   return(0);
  }
//+------------------------------------------------------------------+
//|                                                                  |
//+------------------------------------------------------------------+
int start()
  {
   int    counted_bars=IndicatorCounted();
   if(counted_bars < 0 )
      return(-1);
   //Recalculate last bar
   if(counted_bars > 0 )
      counted_bars++;
//----
   int limit=Bars - counted_bars;
   for(int i=limit-1; i>=0; i--)
     {
      double tma_val=0.0;
      for(int j=0; j<Periods; j++)
        {
         double price=getPrice(ApplyTo, i+Periods-j);
         tma_val+=price*weights[j];
        }
      tma[i]=tma_val/divisor;
     }
   return(0);
  }
//+------------------------------------------------------------------+
//|                                                                  |
//+------------------------------------------------------------------+
double getPrice(int priceType, int index)
  {
   double price=0.0;
//----
   switch(priceType)
     {
      case PRICE_OPEN    : price=Open[index];
         break;
      case PRICE_HIGH    : price=High[index];
         break;
      case PRICE_LOW     : price=Low[index];
         break;
      case PRICE_MEDIAN  : price=(High[index]+Low[index])/2.0;
         break;
      case PRICE_TYPICAL : price=(High[index]+Low[index]+Close[index])/3.0;
         break;
      case PRICE_WEIGHTED: price=(High[index]+Low[index]+2*Close[index])/4.0;
         break;
      case PRICE_CLOSE   :
      default            : price=Close[index];
         break;
     }
   return(price);
  }
//+------------------------------------------------------------------+
Comments