TrendContinuation_v1
Download script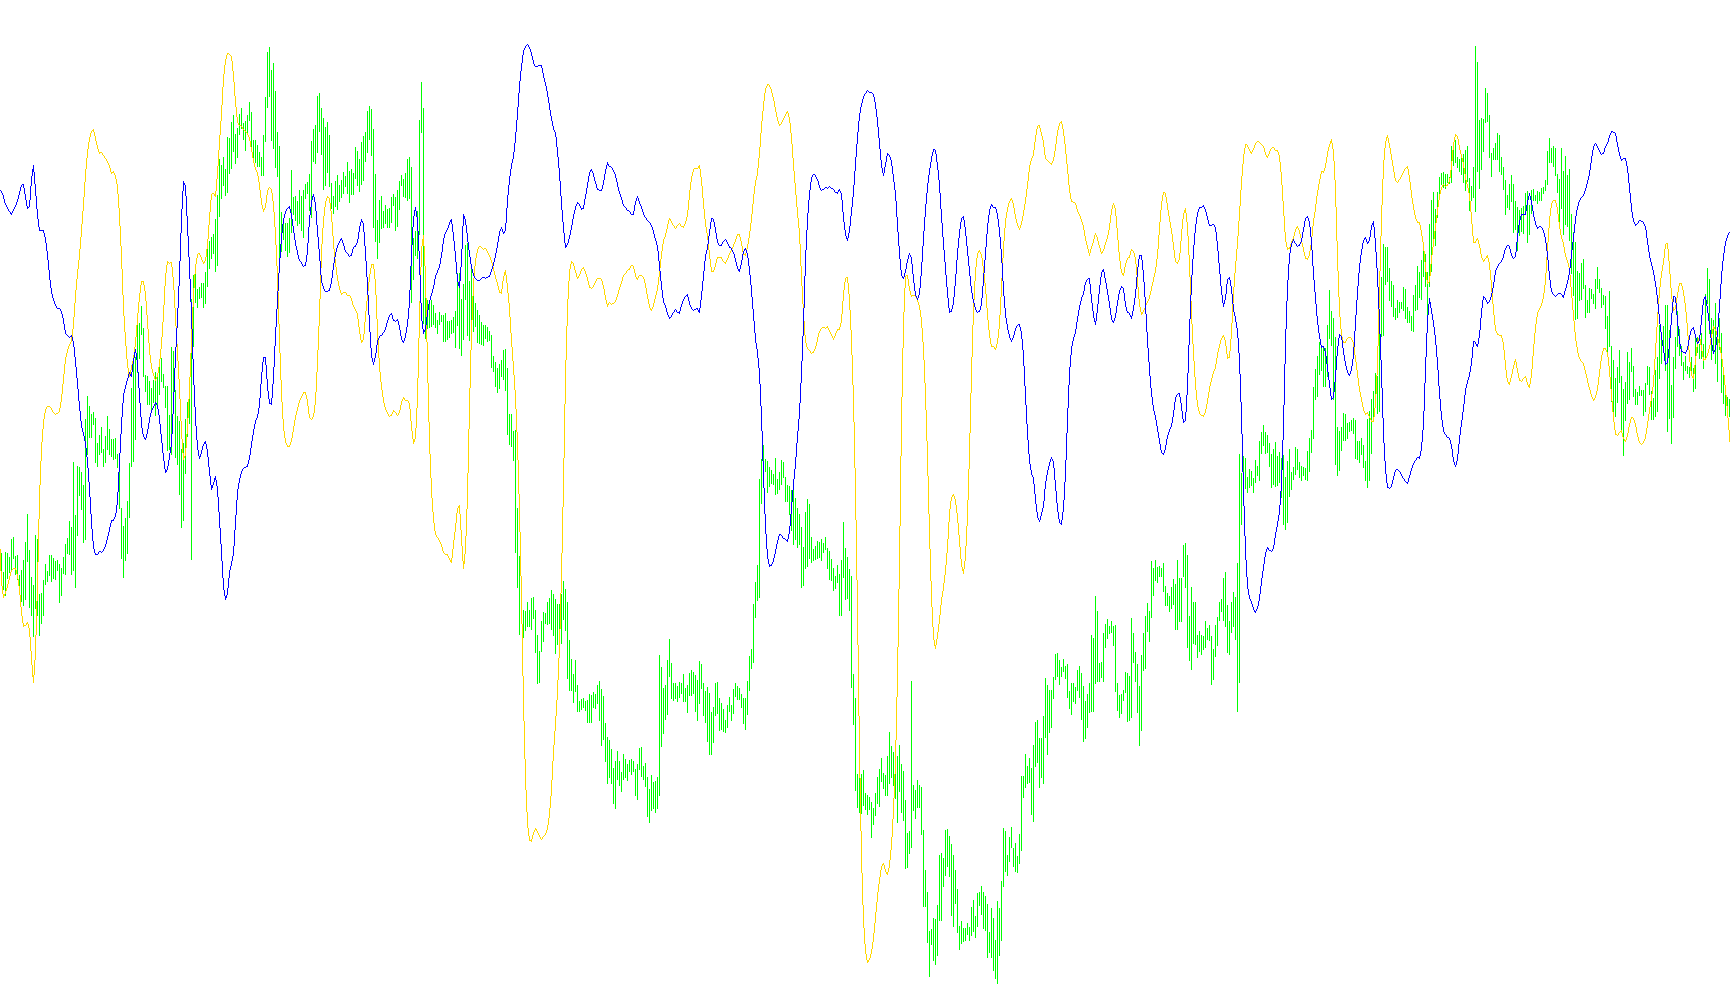
This tool is designed as a technical analysis indicator for trading platforms, specifically created to help traders visualize and interpret market trends. It operates by calculating the "Trend Continuation Factor," which helps identify the momentum and strength of price movements over time.
Core Logic Overview
The script analyzes historical price data to differentiate between upward (bullish) and downward (bearish) movements. Rather than simply looking at whether the price went up or down in a single moment, it calculates the cumulative "effort" behind these movements.
1. Price Movement Tracking The logic begins by scanning the price history. It determines if a candle closed higher or lower than the previous one:
- If the price moved up, it calculates the positive magnitude of that move and adds it to a running total.
- If the price moved down, it calculates the negative magnitude and adds it to a separate running total.
2. Momentum Filtering The script then looks at a specific window of recent bars (defined by the user settings). It aggregates the short-term changes and compares them against the broader cumulative totals. This allows the tool to distinguish between a minor price flicker and a sustained trend continuation. It essentially seeks to answer: Is the current movement part of a persistent trend, or is it just temporary noise?
3. Smoothing and Weighted Calculation To make the data readable for humans, the script applies a multi-layered smoothing process. It uses a weighted moving average technique (similar to a Triple Exponential Moving Average). This involves:
- Calculating intermediate values based on specific weights.
- Passing these values through several stages of smoothing to eliminate "jitter" from the chart.
4. Visual Output The final result is displayed in a separate window below the main price chart as two distinct lines:
- The Blue Line: Represents the trend continuation factor for upward momentum.
- The Red Line: Represents the trend continuation factor for downward momentum.
Summary for the Trader
By observing these two lines, a trader can see the "tug-of-war" between buying and selling pressure. When one line gains significant height or distance from the other, it suggests that the current trend has strong continuation momentum. If the lines are close together or flat, it indicates a period of consolidation or indecision in the market.
/*-----------------------------+
|			       |
| Shared by www.Aptrafx.com    |
|			       |
+------------------------------*/


//+------------------------------------------------------------------+
//|               Trend continuation factor.mq4                      |
//+------------------------------------------------------------------+
#property copyright " Copyright © 2004, MetaQuotes Software Corp."
#property link      " http://www.metaquotes.net/"
#property indicator_separate_window
#property indicator_color1 Blue
#property indicator_buffers 2
#property indicator_color2 Red
#include <stdlib.mqh>
//+------------------------------------------------------------------+
//| Common External variables                                        |
//+------------------------------------------------------------------+
//+------------------------------------------------------------------+
//| External variables                                               |
//+------------------------------------------------------------------+
extern double n = 20;
extern double CountBars = 5000;
extern double t3_period = 5;
extern double b = 0.618;
//+------------------------------------------------------------------+
//| Special Convertion Functions                                     |
//+------------------------------------------------------------------+
int LastTradeTime;
int shift;
double ExtHistoBuffer[];
double ExtHistoBuffer2[];
void SetLoopCount(int loops)
{
}
void SetIndexValue(int shift, double value)
{
  ExtHistoBuffer[shift] = value;
}
void SetIndexValue2(int shift, double value)
{
  ExtHistoBuffer2[shift] = value;
}
//+------------------------------------------------------------------+
//| End                                                              |
//+------------------------------------------------------------------+
//+------------------------------------------------------------------+
//| Initialization                                                   |
//+------------------------------------------------------------------+
int init()
{
   SetIndexStyle(0, DRAW_LINE, STYLE_SOLID);
   SetIndexBuffer(0, ExtHistoBuffer);
   SetIndexStyle(1, DRAW_LINE, STYLE_SOLID);
   SetIndexBuffer(1, ExtHistoBuffer2);
   return(0);
}
int start()
{
//+------------------------------------------------------------------+
//| Local variables                                                  |
//+------------------------------------------------------------------+
//double shift = 0;
int cnt = 0;
double k_n = 0;
double k_p = 0;
int shiftt = 0;
double ch_p = 0;
double ch_n = 0;
double cff_p = 0;
double cff_n = 0;
double AccountedBars = 0;
double CF_p[5001];
double CF_n[5001];
double Change_p[5001];
double Change_n[5001];
double t3 = 0;
double t32 = 0;
double A1 = 0;
double A2 = 0;
double b2 = 0;
double b3 = 0;
double c1 = 0;
double c2 = 0;
double c3 = 0;
double c4 = 0;
double e1 = 0;
double e2 = 0;
double e3 = 0;
double e4 = 0;
double e5 = 0;
double e6 = 0;
double n1 = 0;
double w1 = 0;
double w2 = 0;
double e12 = 0;
double e22 = 0;
double e32 = 0;
double e42 = 0;
double e52 = 0;
double e62 = 0;
/*[[
 Name := Trend Continuation Factor
 Author :ENG.A`ED AL NAIRAB
 Link := http://www.nairab.com/
 Separate Window := Yes
 First Color := Blue
 First Draw Type := Line
 First Symbol := 217
 Use Second Data := Yes
 Second Color := Red
 Second Draw Type := Line
 Second Symbol := 218
]]*/


b2=b*b;
b3=b2*b;
c1=-b3;
c2=(3*(b2+b3));
c3=-3*(2*b2+b+b3);
c4=(1+3*b+b3+3*b2);
n1=t3_period;
if( n1<1 ) n1=1;
n1 = 1 + 0.5*(n1-1);
w1 = 2 / (n1 + 1);
w2 = 1 - w1;
SetLoopCount(0);
// loop from first bar to current bar (with shift=0)
if( AccountedBars == 0 ) AccountedBars = Bars-CountBars;
for(cnt =AccountedBars;cnt <=Bars-1 ;cnt ++){
shift = Bars - 1 - cnt;
{
if( Close[shift] > Close[shift+1])
  { Change_p[shift] = Close[shift]- Close[shift+1];
  CF_p[shift]= Change_p[shift] + CF_p[shift+1];
   Change_n[shift] = 0;
   CF_n[shift]= 0;
   }
     else
  { Change_p[shift] = 0;
   CF_p[shift] = 0;
   Change_n[shift]  = Close[shift+1]- Close[shift];
   CF_n[shift] = Change_n[shift]+ CF_n[shift+1];
   }
}
for(shiftt=shift+n;shiftt>=shift ;shiftt--){
ch_p = Change_p[shiftt] +ch_p;
ch_n = Change_n[shiftt]+ch_n ;
cff_p =  CF_p[shiftt]+cff_p;
cff_n =  CF_n[shiftt]+cff_n;
}
k_p=ch_p-cff_n;
k_n=ch_n-cff_p;
 A1 = k_p;
e1 = w1*A1 + w2*e1;
e2 = w1*e1 + w2*e2;
e3 = w1*e2 + w2*e3;
e4 = w1*e3 + w2*e4;
e5 = w1*e4 + w2*e5;
e6 = w1*e5 + w2*e6;
t3 = c1*e6 + c2*e5 + c3*e4 + c4*e3;
SetIndexValue(shift,t3);
A2 = k_n;
e12 = w1*A2 + w2*e12;
e22 = w1*e12 + w2*e22;
e32 = w1*e22 + w2*e32;
e42 = w1*e32 + w2*e42;
e52 = w1*e42 + w2*e52;
e62 = w1*e52 + w2*e62;
t32 = c1*e62 + c2*e52 + c3*e42 + c4*e32;
SetIndexValue2(shift,t32);
 AccountedBars=AccountedBars+1;
ch_p=0;
ch_n=0;
cff_p=0;
cff_n=0;
}
  return(0);
}

// end//
Comments