Trendlines_v1
Download script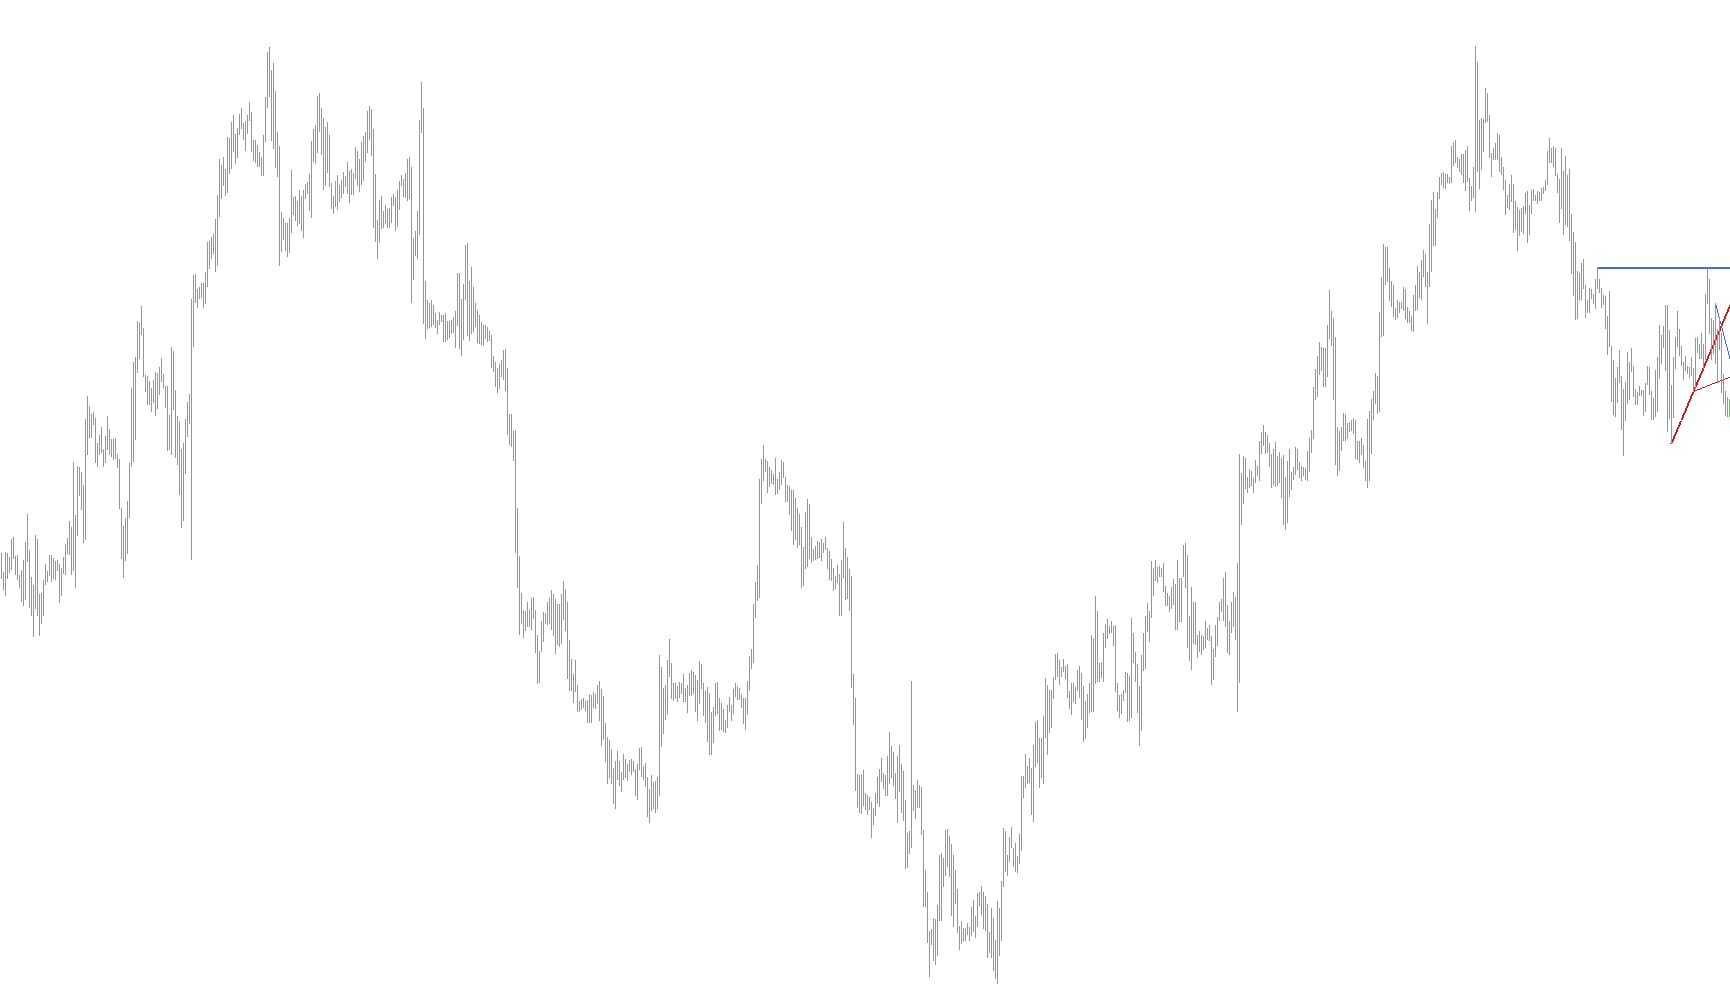
Overview of the Trendline Indicator Logic
This script is designed to automatically identify and visualize key market structure levels—specifically Resistance and Support lines—across multiple timeframes. Instead of requiring manual drawing, the logic scans historical price data to find significant "peaks" (Resistance) and "valleys" (Support) and connects them to form trendlines.
Multi-Timeframe Awareness
The script is intelligent enough to recognize which timeframe you are currently viewing and adjusts its behavior accordingly:
- Contextual Layering: Depending on your current view (e.g., the 5-minute or 15-minute chart), the script will automatically "stack" relevant trendlines from higher timeframes. This allows you to see how smaller price movements relate to larger structural trends.
- Dynamic Rendering: It ensures that trendlines from different periods are displayed clearly, using unique colors, line thicknesses, and styles (such as solid or dashed) to distinguish between them visually.
Detection Logic: Highs and Lows
To determine where a trendline should begin and end, the script employs two primary search mechanisms:
- Higher Highs (Resistance): The logic scans the price history to find points where the price reached a peak that was higher than the bars immediately preceding and following it. It then identifies two of these major peaks to establish a ceiling.
- Lower Lows (Support): Conversely, it searches for "valleys"—points where the price dropped lower than the surrounding data points. It identifies two significant lows to establish a floor.
Precision Mapping and Translation
One of the core features of this logic is its ability to translate data across different timeframes:
- Coordinate Matching: If you are looking at a low-timeframe chart (like 5 minutes) but the script is calculating a trendline from a high-timeframe (like 4 hours), it performs a "Real Position" check. It translates the historical date and price of the high-timeframe peak to its exact corresponding spot on your current chart.
- Object Management: The script automatically handles the creation, moving, and updating of these lines. If a new peak or valley is identified, the trendline updates in real-time. It also ensures that the lines are set as "Rays," allowing them to extend forward into the future to show where potential price reactions might occur.
Visual Organization
The logic applies specific aesthetic rules based on the timeframe:
- 4-Hour Trends: Displayed with thick, solid lines for maximum visibility of primary structure.
- 1-Hour Trends: Displayed as standard solid lines.
- 15-Minute Trends: Displayed as dashed/dotted lines to indicate more fluid, short-term movement.
- Color Coding: Resistance levels are typically highlighted in blue tones, while Support levels are shown in brick-red tones, allowing for immediate visual identification of "Buy" and "Sell" zones.
Price Data Components
11
Views
0
Downloads
0
Favorites
Trendlines_v1
/*-----------------------------+
|			       |
| Shared by www.Aptrafx.com    |
|			       |
+------------------------------*/

//+------------------------------------------------------------------+
//|                                                   Trendlines.mq4 |
//|                                      Copyright © 2006, John Hitt |
//|                                           jhitt@kanji.dyndns.org |
//+------------------------------------------------------------------+
#property copyright "Copyright © 2006, John Hitt"
#property link      "jhitt@kanji.dyndns.org"

#property indicator_chart_window

extern color H4_R=RoyalBlue;
extern color H4_S=FireBrick;
extern color H1_R=RoyalBlue;
extern color H1_S=FireBrick;
extern color M15_R=RoyalBlue;
extern color M15_S=FireBrick;

#define RESISTANCE 1
#define SUPPORT 2

//+------------------------------------------------------------------+
//| Custom indicator initialization function                         |
//+------------------------------------------------------------------+
int init()
  {
//---- indicators

//----
   return(0);
  }
//+------------------------------------------------------------------+
//| Custom indicator deinitialization function                       |
//+------------------------------------------------------------------+
int deinit()
  {
//----
   ObjectDelete("H4_R");
   ObjectDelete("H4_S");
   ObjectDelete("H1_R");
   ObjectDelete("H1_S");
   ObjectDelete("M15_R");
   ObjectDelete("M15_S");
   ObjectDelete("M5_R");
   ObjectDelete("M5_S");
//----
   return(0);
  }
//+------------------------------------------------------------------+
//| Custom indicator iteration function                              |
//+------------------------------------------------------------------+
int start()
  {
   datetime currentbar = 0;

   if (currentbar != Time[0])
   {
      switch (Period())
      {
         case PERIOD_H4:
            Draw_H4_Trends();
            break;
         case PERIOD_H1:
            Draw_H4_Trends();
            Draw_H1_Trends();
            break;
         case PERIOD_M15:
            Draw_H1_Trends();
            Draw_M15_Trends();
            break;
         case PERIOD_M5:
            Draw_M15_Trends();
            break;
       }
   }

   return(0);
  }


void Draw_M15_Trends()
{
   int sbar=0;
   int ebar=0;
   int i;
   double rate_array[][6];

   ArrayCopyRates(rate_array, Symbol(), PERIOD_M15);

   for (i=2; i < Bars; i++)
   {
      if (HigherHigh(i, 1, rate_array) == true)
      {
        //Print("HiherHigh: ", i);
        if (ebar == 0)
          ebar = i;
        else if (sbar == 0 && rate_array[i][3] > rate_array[ebar][3]) // use 3 for high
          sbar = i;
      }
      if (sbar !=0 && ebar !=0)
         break;
   }
   DrawTrendline ("M15_R", ebar, sbar, PERIOD_M15, RESISTANCE, rate_array);

   ebar = 0;
   sbar = 0;

   for (i=2; i < Bars; i++)
   {
      if (LowerLow(i, 1, rate_array) == true)
      {
        if (ebar == 0)
          ebar = i;
        else if (sbar == 0 && rate_array[i][2] < rate_array[ebar][2]) // use 2 for low
          sbar = i;
      }
      if (sbar !=0 && ebar !=0)
         break;
   }
   DrawTrendline ("M15_S", ebar, sbar, PERIOD_M15, SUPPORT, rate_array);

}

void Draw_H1_Trends()
{
   int sbar=0;
   int ebar=0;
   int i;
   double rate_array[][6];

   ArrayCopyRates(rate_array, Symbol(), PERIOD_H1);

   for (i=2; i < Bars; i++)
   {
      if (HigherHigh(i, 1, rate_array) == true)
      {
        //Print("HiherHigh: ", i);
        if (ebar == 0)
          ebar = i;
        else if (sbar == 0 && rate_array[i][3] > rate_array[ebar][3]) // use 3 for high
          sbar = i;
      }
      if (sbar !=0 && ebar !=0)
         break;
   }
   DrawTrendline ("H1_R", ebar, sbar, PERIOD_H1, RESISTANCE, rate_array);

   ebar = 0;
   sbar = 0;

   for (i=2; i < Bars; i++)
   {
      if (LowerLow(i, 1, rate_array) == true)
      {
        if (ebar == 0)
          ebar = i;
        else if (sbar == 0 && rate_array[i][2] < rate_array[ebar][2]) // use 2 for low
          sbar = i;
      }
      if (sbar !=0 && ebar !=0)
         break;
   }
   DrawTrendline ("H1_S", ebar, sbar, PERIOD_H1, SUPPORT, rate_array);

}

void Draw_H4_Trends()
{
   int sbar=0;
   int ebar=0;
   int i;
   double rate_array[][6];

   ArrayCopyRates(rate_array, Symbol(), PERIOD_H4);

   for (i=2; i < Bars; i++)
   {
      if (HigherHigh(i, 1, rate_array) == true)
      {
        //Print("HiherHigh: ", i);
        if (ebar == 0)
          ebar = i;
        else if (sbar == 0 && rate_array[i][3] > rate_array[ebar][3]) // use 3 for high
          sbar = i;
      }
      if (sbar !=0 && ebar !=0)
         break;
   }
   DrawTrendline ("H4_R", ebar, sbar, PERIOD_H4, RESISTANCE, rate_array);

   ebar = 0;
   sbar = 0;

   for (i=2; i < Bars; i++)
   {
      if (LowerLow(i, 1, rate_array) == true)
      {
        if (ebar == 0)
          ebar = i;
        else if (sbar == 0 && rate_array[i][2] < rate_array[ebar][2]) // use 2 for low
          sbar = i;
      }
      if (sbar !=0 && ebar !=0)
         break;
   }
   DrawTrendline ("H4_S", ebar, sbar, PERIOD_H4, SUPPORT, rate_array);
}

 bool HigherHigh (int point, int shift, double array[][6])
  {
    if (shift == 0)
     return (true);

    if (array[point][3] >= array[point+shift][3] && array[point][3] >= array[point-shift][3])
    {
      if (array[point][3] == array[point+shift][3] || array[point][3] == array[point-shift][3])
      {
        if ((point - shift - 1) == 0)
          return (false);
        if (array[point][3] > array[point+shift+1][3] && array[point][3] > array[point-shift-1][3])
          return (HigherHigh (point, shift-1, array));
        else
          return (false);
      } else {
        return (HigherHigh (point, shift-1, array));
      }
    }
    else
      return (false);
  }

  bool LowerLow (int point, int shift, double array[][6])
  {
    if (shift == 0)
     return (true);

    if (array[point][2] <= array[point+shift][2] && array[point][2] <= array[point-shift][2])
    {
      if (array[point][2] == array[point+shift][2] || array[point][2] == array[point-shift][2])
      {
        if ((point-shift-1) == 0)
         return (false);
        if (array[point][2] < array[point+shift+1][2] && array[point][2] < array[point-shift-1][2])
          return(LowerLow (point, shift-1, array));
        else
          return (false);
      } else {
        return(LowerLow (point, shift-1, array));
      }
    }
    else
      return (false);
  }

 int GetRealPosition(int p1, double array[][6], int which, datetime value, double peak)
 {
   int i;

   for (i=0; i < Bars; i++)
   {
     if (array[i][0] == value || array[i][0] < value)
     {
        if (which == RESISTANCE)
        {
          if (array[i][3] == peak) return (i);
          if (array[i-1][3] == peak) return (i-1);
          if (array[i-2][3] == peak) return (i-2);
          if (array[i-3][3] == peak) return (i-3);
         } else {
          if (array[i][2] == peak) return (i);
          if (array[i-1][2] == peak) return (i-1);
          if (array[i-2][2] == peak) return (i-2);
          if (array[i-3][2] == peak) return (i-3);
         }
         if (array[i][0] < value) return (i);
     }
   }
   return (-1);
}

 int DrawTrendline (string name, int p1, int p2, int timeframe, int which, double r_array[][6])
 {
   color hue;
   int thickness = 1;
   int style = STYLE_DASH;
   double array[][6];

   ArrayCopyRates(array, Symbol(), Period());

   if (which == RESISTANCE)
   {
     hue = RoyalBlue;
     if (Period() != timeframe)
     {
       p1 = GetRealPosition(p1, array, which, r_array[p1][0], r_array[p1][3]);
       p2 = GetRealPosition(p2, array, which, r_array[p2][0], r_array[p2][3]);
     }
   }
   else
   {
     hue = FireBrick;
     if (Period() != timeframe)
     {
       p1 = GetRealPosition(p1, array, which, r_array[p1][0], r_array[p1][2]);
       p2 = GetRealPosition(p2, array, which, r_array[p2][0], r_array[p2][2]);
     }
   }

   switch(timeframe)
   {
      case PERIOD_H4:
         thickness = 2;
         style = STYLE_SOLID;
         if (which == RESISTANCE)
           hue = H4_R;
         else
           hue = H4_S;
         break;
      case PERIOD_H1:
         style = STYLE_SOLID;
         thickness = 1;
         if (which == RESISTANCE)
           hue = H1_R;
         else
           hue = H1_S;
         break;
      case PERIOD_M15:
         style = STYLE_DASHDOTDOT;
         thickness = 1;
         if (which == RESISTANCE)
           hue = M15_R;
         else
           hue = M15_S;
         break;
   }

   if (ObjectFind(name) < 0)
   {
     if (which == SUPPORT)
       ObjectCreate(name, OBJ_TREND, 0, array[p2][0], array[p2][2], array[p1][0], array[p1][2]);
     else
       ObjectCreate(name, OBJ_TREND, 0, array[p2][2], array[p2][3], array[p1][0], array[p1][3]);

     ObjectSet(name, OBJPROP_COLOR, hue);
     ObjectSet(name, OBJPROP_RAY, true);
     ObjectSet(name, OBJPROP_BACK, true);
     ObjectSet(name, OBJPROP_WIDTH, thickness);
     ObjectSet(name, OBJPROP_STYLE, style);
   }

   if (which == SUPPORT)
   { // Lows (0 == Time)
     ObjectMove (name, 0, array[p2][0], array[p2][2]);
     ObjectMove (name, 1, array[p1][0], array[p1][2]);
   }
   else
   { // Highs
     ObjectMove (name, 0, array[p2][0], array[p2][3]);
     ObjectMove (name, 1, array[p1][0], array[p1][3]);
   }

   ObjectsRedraw();
   return(0);
 }
Comments