Trendlinesday
Download script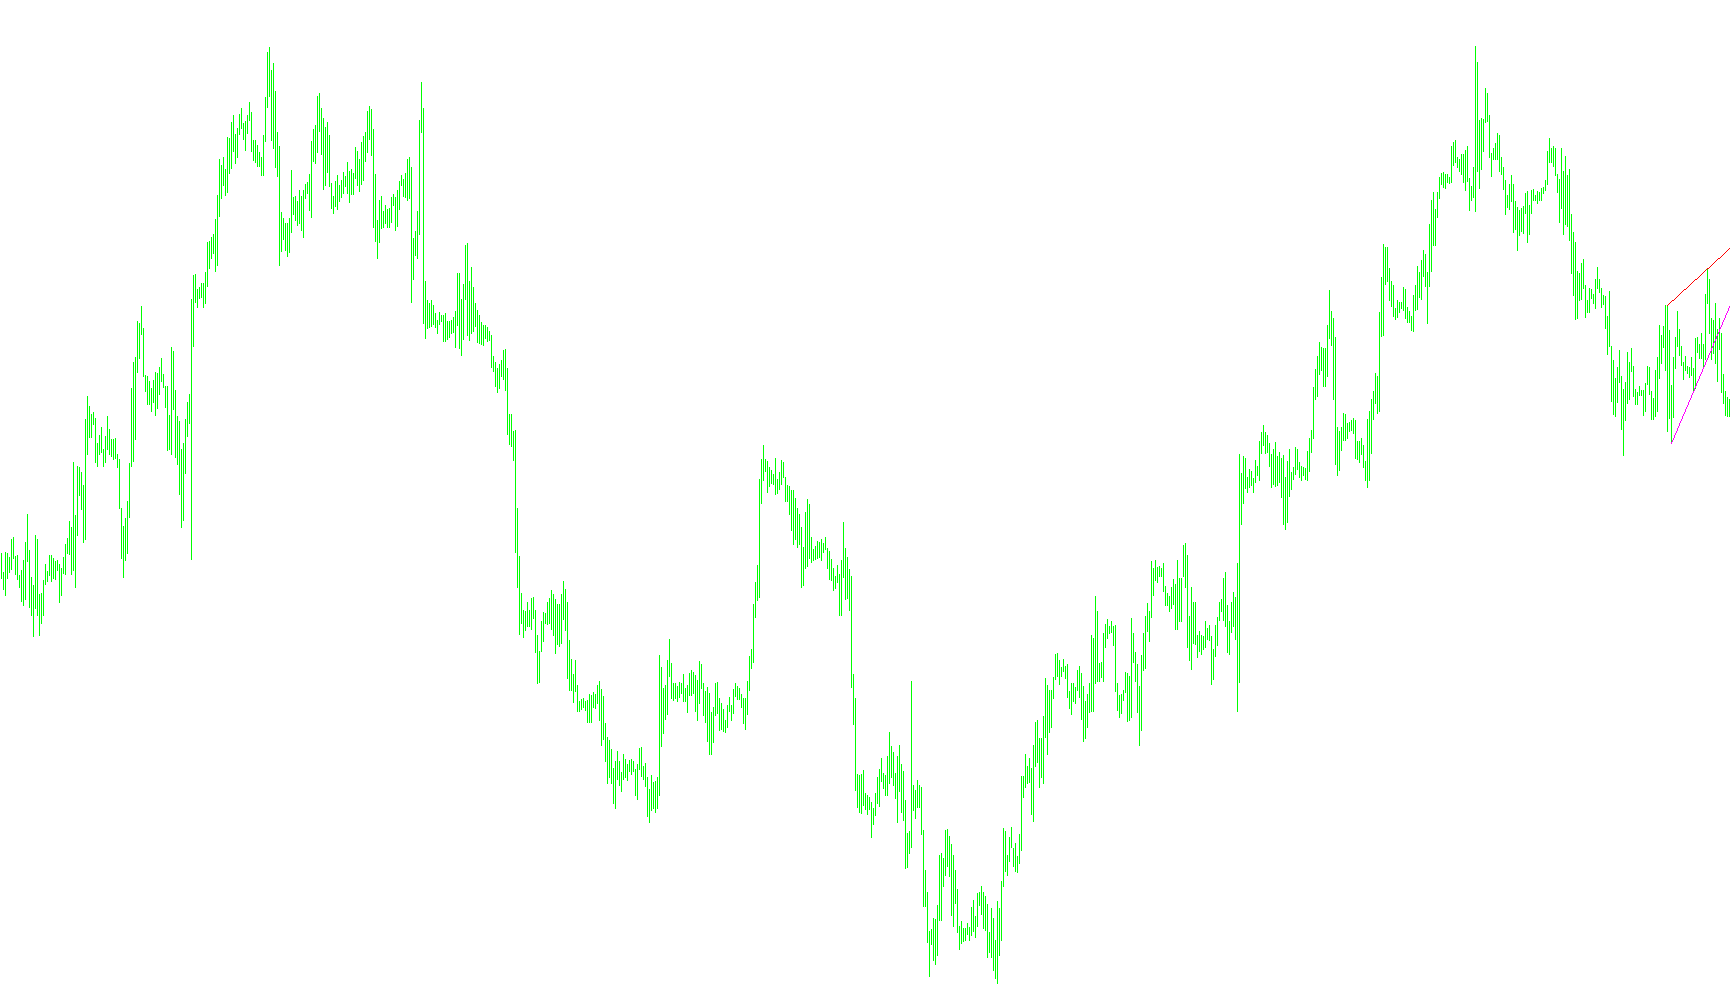
This script is designed to provide a visual tool for traders who want to automatically identify key market structures—specifically significant price levels and trend directions—on their trading charts. By automating the identification of historical highs and lows, it helps simplify the process of spotting potential support and resistance zones.
Core Functionality
The logic operates by scanning the most recent price history to pinpoint extreme price points. Here is a breakdown of how it processes that data:
- Historical Analysis: The script looks back at a specific number of past candles (defined by the user) to find the highest peaks and lowest valleys. It prioritizes these "swing points" as they often represent areas where buyers or sellers have previously stepped in with significant force.
- Dynamic Tracking: Instead of just marking a single point in time, the script maintains a sequence of these high and low points. It organizes them into a history, allowing the tool to understand the progression of the market over time rather than looking at price movements in isolation.
- Automated Trend Visualization: The primary output of this logic is the creation of trend lines on your chart. It connects these identified peaks and valleys automatically:
- Downward Trends: It identifies significant "lows" and draws connecting lines to visualize descending price action (often represented in magenta).
- Upward Trends: It identifies significant "highs" and draws connecting lines to visualize ascending price action (often represented in aqua).
How it Benefits the User
By using this logic, the chart becomes more organized. Rather than manually drawing dozens of lines to see where the market might turn, the script highlights the most relevant structural shifts. This allows a trader to quickly see:
- Where the current price trend is originating from.
- The "floor" and "ceiling" of recent price action.
- The overall momentum of the market by observing the angle and connection of the automatically generated trend lines.
In essence, this script acts as a structural scout, scanning the past to highlight the most important geometric patterns of the market's history so that you can make more informed decisions on current price movements.
//+------------------------------------------------------------------+
//|                                                trendlinesDay.mq4 |
//|                      Copyright © 2008, MetaQuotes Software Corp. |
//|                                        http://www.metaquotes.net |
//+------------------------------------------------------------------+
#property copyright "Copyright © 2008, MetaQuotes Software Corp."
#property link      "http://www.metaquotes.net"

//+------------------------------------------------------------------+
//|                                       Ind-WSO+WRO+Trend Line.mq4 |
//|                    Copyright © 2004, http://www.expert-mt4.nm.ru |
//|                                      http://www.expert-mt4.nm.ru |
//+------------------------------------------------------------------+
#property copyright "nsi2000"
#property link      "http://www.expert-mt4.nm.ru"

#property indicator_chart_window
//---- input parameters
extern int nPeriod=10;
extern int Limit=350;
///---- int Widners Oscilator
int cnt,nCurBar=0;

//+------------------------------------------------------------------+
//| Custom indicator initialization function                         |
//+------------------------------------------------------------------+
int init()
  {
//---- Output in Char
   for(cnt=0; cnt<=5; cnt++)
    {
      ObjectCreate("WSO-"+cnt,OBJ_HLINE,0,0,0);
      ObjectSet("WSO-"+cnt,OBJPROP_COLOR,Red);
   if(cnt<5)
      {
      ObjectCreate("Trend DN-"+cnt,OBJ_TREND,0,0,0,0,0);
      ObjectSet("Trend DN-"+cnt,OBJPROP_COLOR,Magenta);
      }
//----
      ObjectCreate("WRO-"+cnt,OBJ_HLINE,0,0,0);
      ObjectSet("WRO-"+cnt,OBJPROP_COLOR,Blue);
   if(cnt<5)
      {
      ObjectCreate("Trend UP-"+cnt,OBJ_TREND,0,0,0,0,0);
      ObjectSet("Trend Up-"+cnt,OBJPROP_COLOR,Aqua);
      }
    }
//----
   return(0);
  }
//+------------------------------------------------------------------+
//| Custor indicator deinitialization function                       |
//+------------------------------------------------------------------+
int deinit()
  {
//---- TODO: add your code here
   for(cnt=0; cnt<=5; cnt++)
      {
      ObjectDelete("Trend UP-"+cnt);
      ObjectDelete("Trend DN-"+cnt);
      ObjectDelete("WSO-"+cnt);
      ObjectDelete("WRO-"+cnt);
      }
//----
   return(0);
  }
//+------------------------------------------------------------------+
//| Custom indicator iteration function                              |
//+------------------------------------------------------------------+
int start()
  {
//---- TODO: add your code here
   double r1,r2,r3,r4,r5,r6;
   int rt1,rt2,rt3,rt4,rt5,rt6;
   double s1,s2,s3,s4,s5,s6;
   int st1,st2,st3,st4,st5,st6;
//---- Ëèíèè ñîïðîòèâëåíèÿ è ïîääåðæêè
if(Bars<Limit) Limit=Bars-nPeriod;
for(nCurBar=Limit; nCurBar>0; nCurBar--)
   {
   if(Low[nCurBar+(nPeriod-1)/2] == Low[Lowest(NULL,0,MODE_LOW,nPeriod,nCurBar)])
      {
      s6=s5; s5=s4; s4=s3; s3=s2; s2=s1; s1=Low[nCurBar+(nPeriod-1)/2];
      st6=st5; st5=st4; st4=st3; st3=st2; st2=st1; st1=nCurBar+(nPeriod-1)/2;
      }
   if(High[nCurBar+(nPeriod-1)/2] == High[Highest(NULL,0,MODE_HIGH,nPeriod,nCurBar)])
      {
      r6=r5; r5=r4; r4=r3; r3=r2; r2=r1; r1=High[nCurBar+(nPeriod-1)/2];
      rt6=rt5; rt5=rt4; rt4=rt3; rt3=rt2; rt2=rt1; rt1=nCurBar+(nPeriod-1)/2;
      }
   }
//---- Move Object in Chart

ObjectMove("Trend DN-0",1,Time[st1],s1);
ObjectMove("Trend DN-0",0,Time[st2],s2);


//----

ObjectMove("Trend UP-0",1,Time[rt1],r1);
ObjectMove("Trend UP-0",0,Time[rt2],r2);


//----
   return(0);
  }
//--------------------------------------------------+
Comments