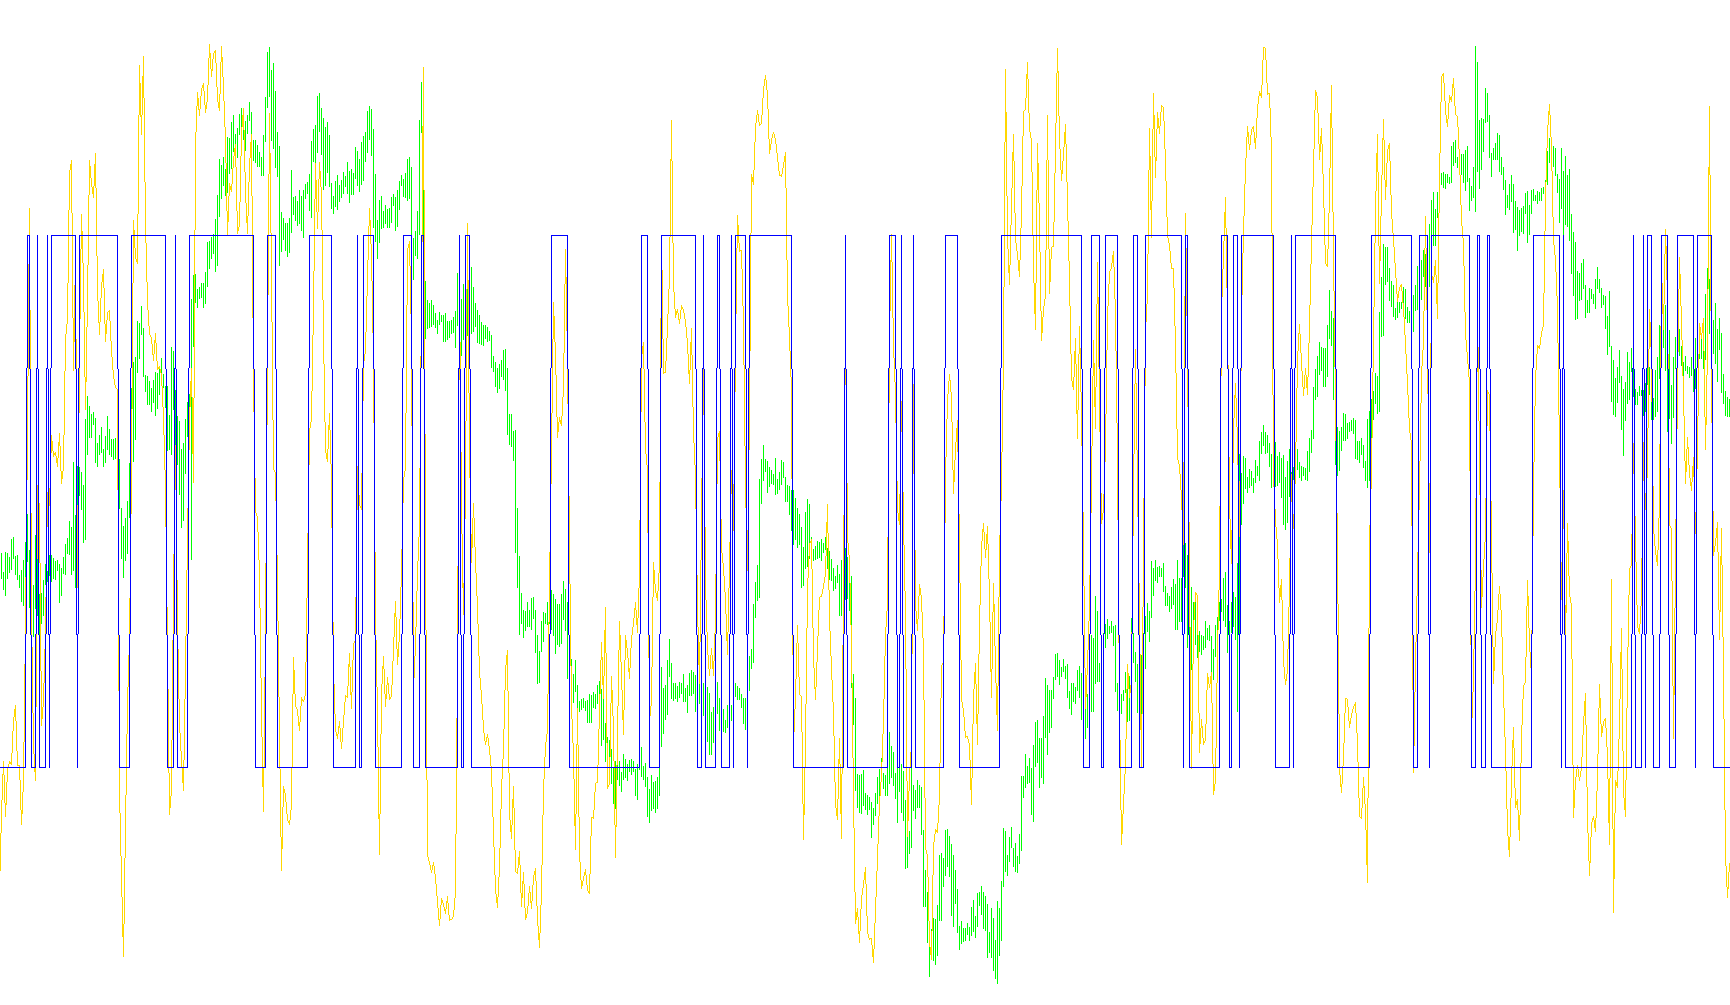
The TrendScalpIndc is a visual trading tool designed to help market participants identify and gauge the momentum of current price trends by measuring "buying power" against "selling power." It functions as a sentiment oscillator, providing a clear perspective on whether the bulls or the bears are currently dominating the market.
Core Logic and Methodology
The indicator operates by analyzing two distinct timeframes of price action simultaneously: a very short-term window (the immediate recent price) and a slightly longer historical window.
- Power Assessment: The script identifies the highest price point reached in the most recent bar and compares it against the lowest price point from a broader period. It then performs a secondary calculation, comparing the highest point of that broader period against the lowest point of the immediate recent bar.
- Comparative Analysis: By subtracting these values from one another, the tool calculates "Buy Power" and "Sell Power." This reveals the intensity of the upward pressure versus the downward pressure over those specific intervals.
- Trend Calculation: The indicator translates these power figures into a percentage-based oscillator. A positive result suggests that buying momentum is outweighing selling pressure, while a negative result indicates the opposite.
Visual Representation and Smoothing
The tool provides two primary visual outputs to help users interpret the data:
- Primary Trend Line: This represents the raw strength of the trend. It shows the fluctuating percentage of market dominance.
- Smoothing Option (T3): For traders who find raw price action too erratic, the script includes an optional "T3 Smoothing" filter. When activated, this uses a complex mathematical formula to "clean" the data, removing minor market noise to reveal a smoother, more stable trend line without sacrificing the responsiveness of the indicator.
- Binary Sentiment Signal: In addition to the main line, the script provides a simplified visual signal. It effectively acts as a "switch," highlighting when the momentum has crossed into a definitive positive or negative state, making it easier for users to quickly identify shifts in market direction.
Practical Use Case
For a visitor looking to understand this tool's purpose: it is designed for Trend Scalping. It allows a trader to see not just where the price is moving, but how hard it is pushing in that direction. By observing the relationship between the immediate price action and the recent historical high/lows, the indicator helps users stay aligned with the dominant market flow while identifying potential exhaustion points in a trend.
//+------------------------------------------------------------------+
//|                                               TrendScalpIndc.mq4 |
//|                      Copyright © 2005, MetaQuotes Software Corp. |
//|                                        http://www.metaquotes.net |
//+------------------------------------------------------------------+
#property copyright "Copyright © 2005, MetaQuotes Software Corp."
#property link      "http://www.metaquotes.net"

#property indicator_separate_window
#property indicator_buffers 2
#property indicator_color1 DeepSkyBlue
#property indicator_color2 RoyalBlue

//---- Parameters
extern int TTFbars=15;
extern bool UseT3Smoothing=false;
extern int t3_period = 5;
extern double b=0.7;
extern int maxbars=5000;

//---- buffers
double ExtMapBuffer1[];
double ExtMapBuffer2[];

//+------------------------------------------------------------------+
//| Custom indicator initialization function                         |
//+------------------------------------------------------------------+
int init()
  {
//---- indicators
   SetIndexStyle(0,DRAW_LINE);
   SetIndexBuffer(0,ExtMapBuffer1);
   SetIndexStyle(1,DRAW_LINE);
   SetIndexBuffer(1,ExtMapBuffer2);
//----
   return(0);
  }
//+------------------------------------------------------------------+
//| Custor indicator deinitialization function                       |
//+------------------------------------------------------------------+
int deinit()
  {
//----

//----
   return(0);
  }
//+------------------------------------------------------------------+
//| Custom indicator iteration function                              |
//+------------------------------------------------------------------+
int start()
  {
   int    i,k;
   int    counted_bars=IndicatorCounted();
   i=Bars-1;
   if(counted_bars>0) i=Bars-counted_bars+0;

//Note:  to add the spread to the highesthigh price then uncomment below
   double sp = (MarketInfo(Symbol(),MODE_SPREAD)*Point);
//   double sp = 0;
//----
   double HighestHighRecent, HighestHighOlder, LowestLowRecent, LowestLowOlder, BuyPower, SellPower, TTF, TTF1;

   i = MathMin(i,maxbars);

   while (i>=0)
   {

	     HighestHighRecent=High[Highest(NULL,0,MODE_HIGH,1, i+1)] + sp;
	     HighestHighOlder =High[Highest(NULL,0,MODE_HIGH,TTFbars,i+2)] + sp;
	     LowestLowRecent =Low[Lowest(NULL,0,MODE_LOW ,1,i+1)];
	     LowestLowOlder =Low[Lowest(NULL,0,MODE_LOW ,TTFbars,i+2)];
	     BuyPower =HighestHighRecent-LowestLowOlder;
	     SellPower=HighestHighOlder -LowestLowRecent;

	     TTF1=(BuyPower-SellPower)/(0.5*(BuyPower+SellPower))*100;

	     if (UseT3Smoothing)
            TTF = GetT3Val( Symbol(), t3_period, b, TTF1);
	     else
	         TTF = TTF1;

	     ExtMapBuffer1[i] = TTF;
	     if (TTF>=0)
	        ExtMapBuffer2[i] = 100;
	     else
	        ExtMapBuffer2[i] = -100;

        i--;
   }

//----
   return(0);
  }
//+------------------------------------------------------------------+

double GetT3Val( string symbol, int t3_Period, double b, double dVal)
{
   double e1,e2,e3,e4,e5,e6;
   double c1,c2,c3,c4;
   double n,w1,w2,b2,b3;

   e1=0; e2=0; e3=0; e4=0; e5=0; e6=0;
   c1=0; c2=0; c3=0; c4=0;
   n=0;
   w1=0; w2=0;
   b2=0; b3=0;

   b2=b*b;
   b3=b2*b;
   c1=-b3;
   c2=(3*(b2+b3));
   c3=-3*(2*b2+b+b3);
   c4=(1+3*b+b3+3*b2);
   n=t3_Period;

   if (n<1) n=1;
   n = 1 + 0.5*(n-1);
   w1 = Div(2,(n + 1));
   w2 = 1 - w1;


//---- indicator calculation

        e1 = w1* (dVal) + w2*e1;
        e2 = w1*e1 + w2*e2;
        e3 = w1*e2 + w2*e3;
        e4 = w1*e3 + w2*e4;
        e5 = w1*e4 + w2*e5;
        e6 = w1*e5 + w2*e6;

        return (NormalizeDouble( c1*e6 + c2*e5 + c3*e4 + c4*e3, MarketInfo(symbol,MODE_DIGITS)));
}

//+------------------------------------------------------------------+
double Div(double nVal, double nDiv)
{
   if (nVal == 0 || nDiv == 0)
   {
      return (0);
   }
   return (nVal/nDiv);
}
Comments