Trendsignal
Download script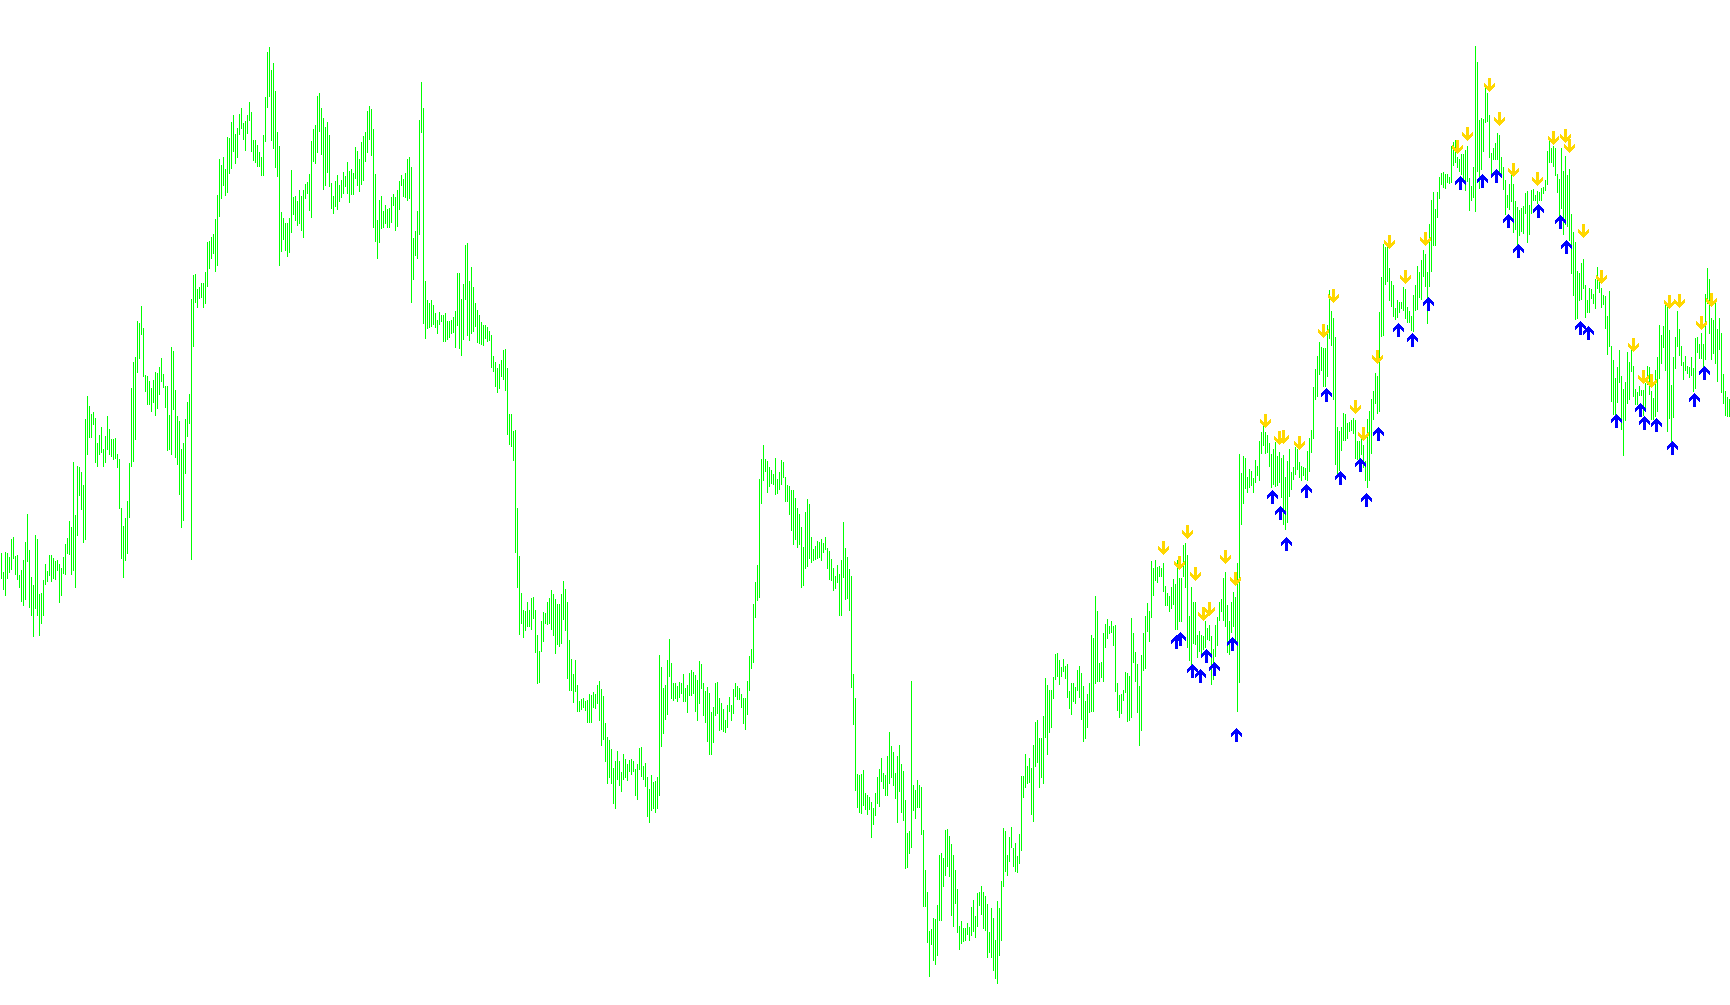
This tool is designed to function as a visual signaling system for traders, identifying specific moments in market price action to highlight potential trend reversals or significant movements. It operates by analyzing historical price data—specifically looking at high, low, open, and close prices—over a set period of time to determine the "momentum" and "volatility" of the market.
How the Logic Works
1. Volatility and Range Measurement The script begins by calculating the average range of price movement over the most recent bars. By determining how much the price typically fluctuates in a short window, the tool creates a baseline for what constitutes a "normal" move versus an "extraordinary" move.
2. Significant Movement Detection Once the average range is established, the logic scans the data to find two specific types of significant price actions:
- Gap/Jump Analysis: It looks for instances where there is a sharp disconnection between the opening and closing prices that exceeds twice the normal average range.
- Trend Acceleration: It looks for sustained movements where the distance between current prices and previous prices reaches nearly five times the normal average range.
3. Momentum Scoring (MRO) The script uses these detections to assign a "Momentum Rating." If it detects a significant jump or a heavy trend acceleration, it adjusts its internal settings to be more sensitive. This helps the tool distinguish between a standard market fluctuation and a high-energy move that might signal a change in direction.
4. Signal Generation (The Arrows) The final output is produced by combining the momentum rating with a secondary indicator (a percentage-based oscillator). The logic follows these rules:
- Sell Signals (Red): If the momentum is falling and crosses below a specific "oversold" threshold, the script looks ahead to see if the price moves back into a neutral zone. If it does, it places a signal above the high of that candle.
- Buy Signals (Green): Conversely, if the momentum is rising and crosses above an "overbought" threshold, the script checks to see if the price pulls back into a neutral zone. If confirmed, it places a signal below the low of that candle.
Summary for the User
Essentially, this script filters out the "noise" of daily market movement. It only provides visual signals when the market exhibits enough force to break out of its normal range and then shows a specific pattern of stabilization. The arrows on your chart represent these confirmed moments where high-momentum price action has met a specific technical threshold.
//+------------------------------------------------------------------+
//| //| Ramdass - Conversion only
//+------------------------------------------------------------------+

#property indicator_chart_window
#property indicator_buffers 2
#property indicator_color1 Red
#property indicator_color2 Green

//---- input parameters
extern int RISK=0;
extern int CountBars=300;

//---- buffers
double val1[];
double val2[];


//+------------------------------------------------------------------+
//| Custom indicator initialization function                         |
//+------------------------------------------------------------------+
int init()
  {
//---- indicator line
   IndicatorBuffers(2);
   SetIndexStyle(0,DRAW_ARROW);
   SetIndexArrow(0,234);
   SetIndexStyle(1,DRAW_ARROW);
   SetIndexArrow(1,233);
   SetIndexBuffer(0,val1);
   SetIndexBuffer(1,val2);

//----
   return(0);
  }
//+------------------------------------------------------------------+
//| ASCTrend1sig                                                     |
//+------------------------------------------------------------------+
int start()
  {
   if (CountBars>=1000) CountBars=950;
   SetIndexDrawBegin(0,Bars-CountBars+11+1);
   SetIndexDrawBegin(1,Bars-CountBars+11+1);
   int i,shift,counted_bars=IndicatorCounted();
   int Counter,i1,value10,value11;
   double value1,x1,x2;
   double value2,value3;
   double TrueCount,Range,AvgRange,MRO1,MRO2;
   double Table_value2[1000];

   value10=3+RISK*2;
   x1=67+RISK;
   x2=33-RISK;
   value11=value10;
//----
   if(Bars<=11+1) return(0);
//---- initial zero
   if(counted_bars<11+1)
   {
      for(i=1;i<=0;i++) val1[CountBars-i]=0.0;
      for(i=1;i<=0;i++) val2[CountBars-i]=0.0;
   }
//----
   shift=CountBars-11-1;
   while(shift>=0)
     {

   Counter=shift;
	Range=0.0;
	AvgRange=0.0;
	for (Counter=shift; Counter<=shift+9; Counter++) AvgRange=AvgRange+MathAbs(High[Counter]-Low[Counter]);

	Range=AvgRange/10;
	Counter=shift;
	TrueCount=0;
	while (Counter<shift+9 && TrueCount<1)
		{if (MathAbs(Open[Counter]-Close[Counter+1])>=Range*2.0) TrueCount=TrueCount+1;
		Counter=Counter+1;
		}
	if (TrueCount>=1) {MRO1=Counter;} else {MRO1=-1;}
	Counter=shift;
	TrueCount=0;
	while (Counter<shift+6 && TrueCount<1)
		{if (MathAbs(Close[Counter+3]-Close[Counter])>=Range*4.6) TrueCount=TrueCount+1;
		Counter=Counter+1;
		}
	if (TrueCount>=1) {MRO2=Counter;} else {MRO2=-1;}
	if (MRO1>-1) {value11=3;} else {value11=value10;}
	if (MRO2>-1) {value11=4;} else {value11=value10;}
	value2=100-MathAbs(iWPR(NULL,0,value11,shift)); // PercentR(value11=9)
	Table_value2[shift]=value2;
	val1[shift]=0;
	val2[shift]=0;
	value3=0;
	if (value2<x2)
		{i1=1;
		while (Table_value2[shift+i1]>=x2 && Table_value2[shift+i1]<=x1){i1++;}
		if (Table_value2[shift+i1]>x1)
			{
			value3=High[shift]+Range*0.5;
			val1[shift]=value3;
			}
		}
	if (value2>x1)
		{i1=1;
		while (Table_value2[shift+i1]>=x2 && Table_value2[shift+i1]<=x1){i1++;}
		if (Table_value2[shift+i1]<x2)
			{
			value3=Low[shift]-Range*0.5;
			val2[shift]=value3;
			}
		}

      shift--;
     }

   return(0);
  }
//+------------------------------------------------------------------+
Comments