triangulatMA_v2
Download script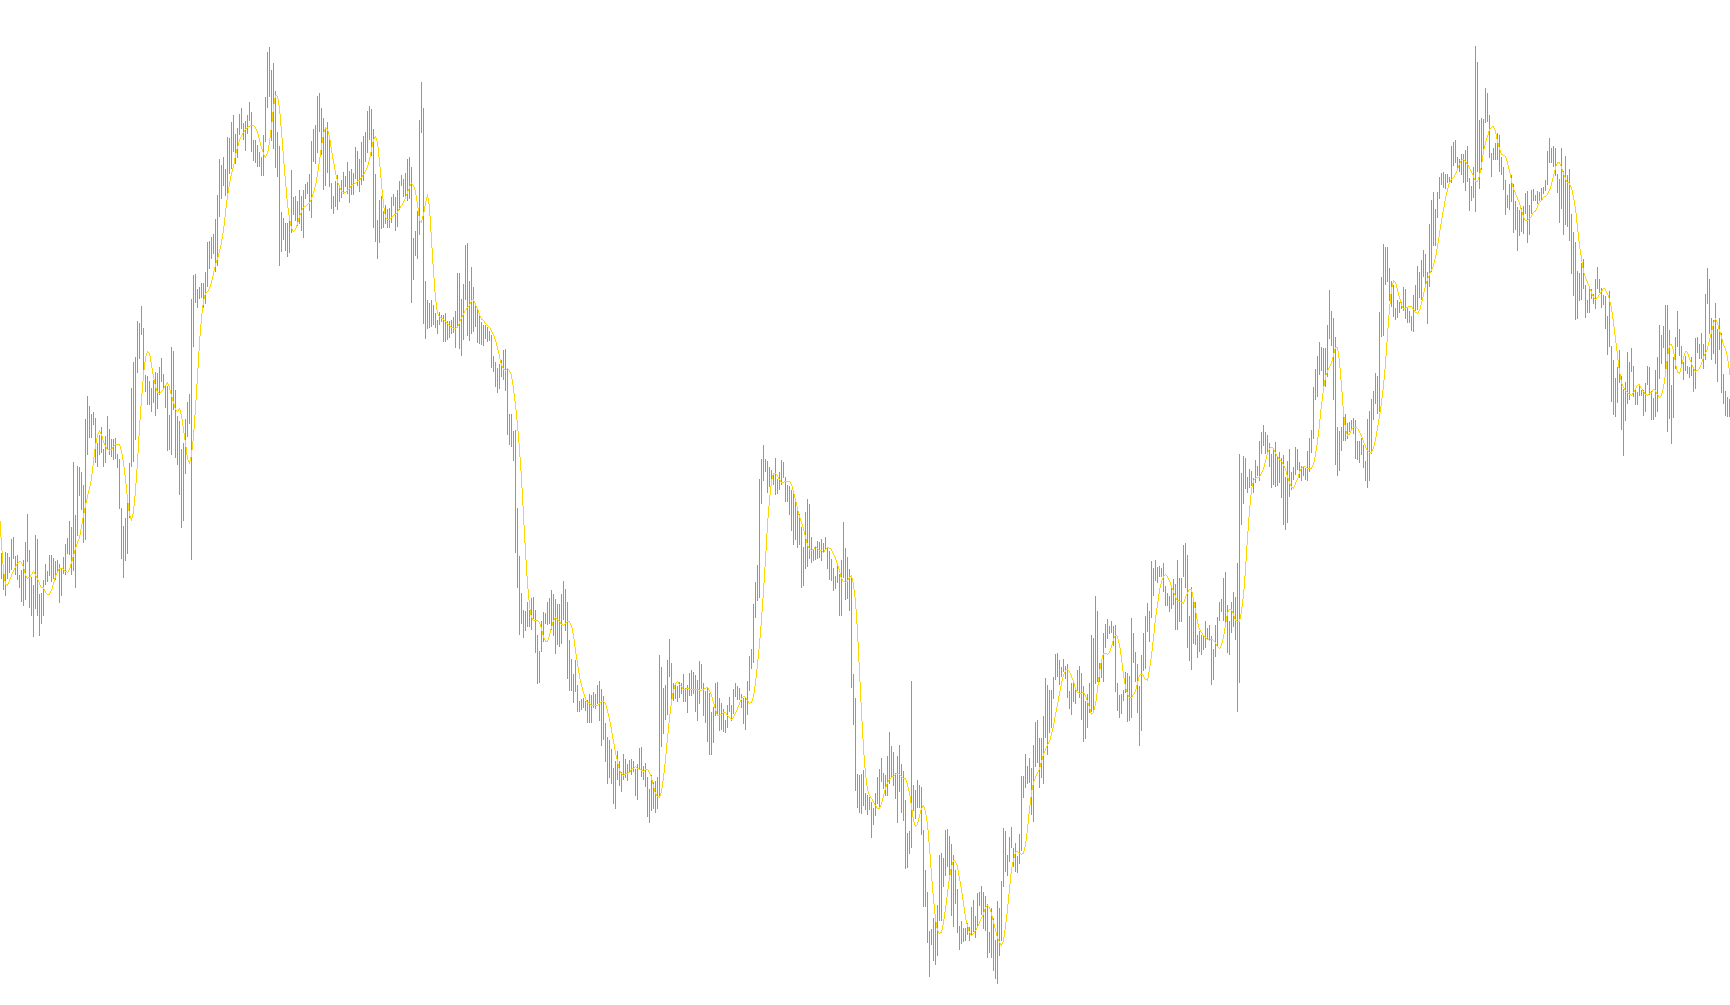
This script is designed to provide a smoothed visualization of market price movements on a trading chart. It functions as a specialized moving average that helps traders identify trends by filtering out "market noise"—those minor, erratic price fluctuations that can often make it difficult to see the broader direction of the market.
How the Logic Works
1. Weighted Importance Unlike a standard simple moving average, where every data point in a period is treated with equal importance, this script uses a "weighted" approach. It assigns higher significance to price points that are closer to the present moment. This allows the indicator to react more dynamically to recent market shifts while still maintaining a smooth profile based on historical data.
2. Custom Weight Distribution The logic calculates a specific mathematical sequence for these weights. It creates a balanced distribution where the center of the selected period holds the most influence, gradually tapering off toward the older data points. This ensures that the resulting line represents a "centered" view of price action, providing a more fluid and less jagged visual than many other standard indicators.
3. Customizable Price Sources The script offers significant flexibility regarding which type of data it should analyze. While most traders look at the final closing price of a candle, this tool allows you to choose from several different market perspectives, including:
- Open/High/Low prices
- Median prices (an average of the high and low)
- Typical prices (an average of the high, low, and close)
- Weighted Close prices (a calculation that gives extra importance to the closing price)
4. Dynamic Calculation Every time the market updates, the script recalculates the moving average by gathering a set number of previous price points (defined by the user). It multiplies each price by its corresponding weight, sums them up, and divides by a total divisor to produce a single, clean line on the chart.
Summary for the User
In essence, this tool acts as a "smoothing filter." By using weighted averages rather than simple ones, it attempts to provide a clearer picture of where the price is headed, making it easier to spot significant trends while ignoring the minor "hiccups" of the market. You can adjust how many periods the script looks back at and which specific price data it focuses on to best suit your personal trading strategy.
//+------------------------------------------------------------------+
//|                                                          TMA.mq4 |
//|                                                     Matias Romeo |
//|                                    mailto:matias.romeo@gmail.com |
//+------------------------------------------------------------------+
#property copyright "Matias Romeo"
#property link      "mailto:matias.romeo@gmail.com"
//----
#property indicator_chart_window
#property indicator_buffers 1
#property indicator_color1 Red
//Input parameters
extern int       Periods=7;
extern int       ApplyTo=0;
//Apply To like "Applied price enumeration"
//0 Close price.
//1 Open price.
//2 High price.
//3 Low price.
//4 Median price, (high+low)/2.
//5 Typical price, (high+low+close)/3.
//6 Weighted close price, (high+low+close+close)/4
//Indicator buffers
double tma[];
//Global variables
int    weights[];
double divisor;
//+------------------------------------------------------------------+
//|                                                                  |
//+------------------------------------------------------------------+
int init()
  {
   SetIndexStyle(0,DRAW_LINE);
   SetIndexBuffer(0,tma);
//----
   IndicatorShortName( "TMA(" + Periods + ")" );
   //Calculate weigths
   ArrayResize(weights,Periods);
//----
   double dPeriods=Periods;
   int to=MathCeil(dPeriods/2.0);
   for(int i=0; i<to; i++)
     {
      weights[i]           =i+1;
      weights[Periods-1-i] =i+1;
     }
   divisor=0.0;
   for(int j=0; j<Periods; j++)
      divisor+=weights[j];
   return(0);
  }
//+------------------------------------------------------------------+
//|                                                                  |
//+------------------------------------------------------------------+
int deinit()
  {
   return(0);
  }
//+------------------------------------------------------------------+
//|                                                                  |
//+------------------------------------------------------------------+
int start()
  {
   int    counted_bars=IndicatorCounted();
   if(counted_bars < 0 )
      return(-1);
   //Recalculate last bar
   if(counted_bars > 0 )
      counted_bars++;
//----
   int limit=Bars - counted_bars;
//----
   for(int i=limit-1; i>=0; i--)
     {
      double tma_val=0.0;
      for(int j=0; j<Periods; j++)
        {
         double price=getPrice(ApplyTo, i+Periods-j);
         tma_val+=price*weights[j];
        }
      tma[i]=tma_val/divisor;
     }
   return(0);
  }
//+------------------------------------------------------------------+
//|                                                                  |
//+------------------------------------------------------------------+
double getPrice(int priceType, int index)
  {
   double price=0.0;
//----
   switch(priceType)
     {
      case PRICE_OPEN    : price=Open[index];
         break;
      case PRICE_HIGH    : price=High[index];
         break;
      case PRICE_LOW     : price=Low[index];
         break;
      case PRICE_MEDIAN  : price=(High[index]+Low[index])/2.0;
         break;
      case PRICE_TYPICAL : price=(High[index]+Low[index]+Close
        [index])/3.0;
         break;
      case PRICE_WEIGHTED: price=(High[index]+Low[index]+2*Close
        [index])/4.0;
         break;
      case PRICE_CLOSE   :
      default            : price=Close[index];
         break;
     }
   return(price);
  }
//+------------------------------------------------------------------+
Comments