Triggerlines1_v1
Download script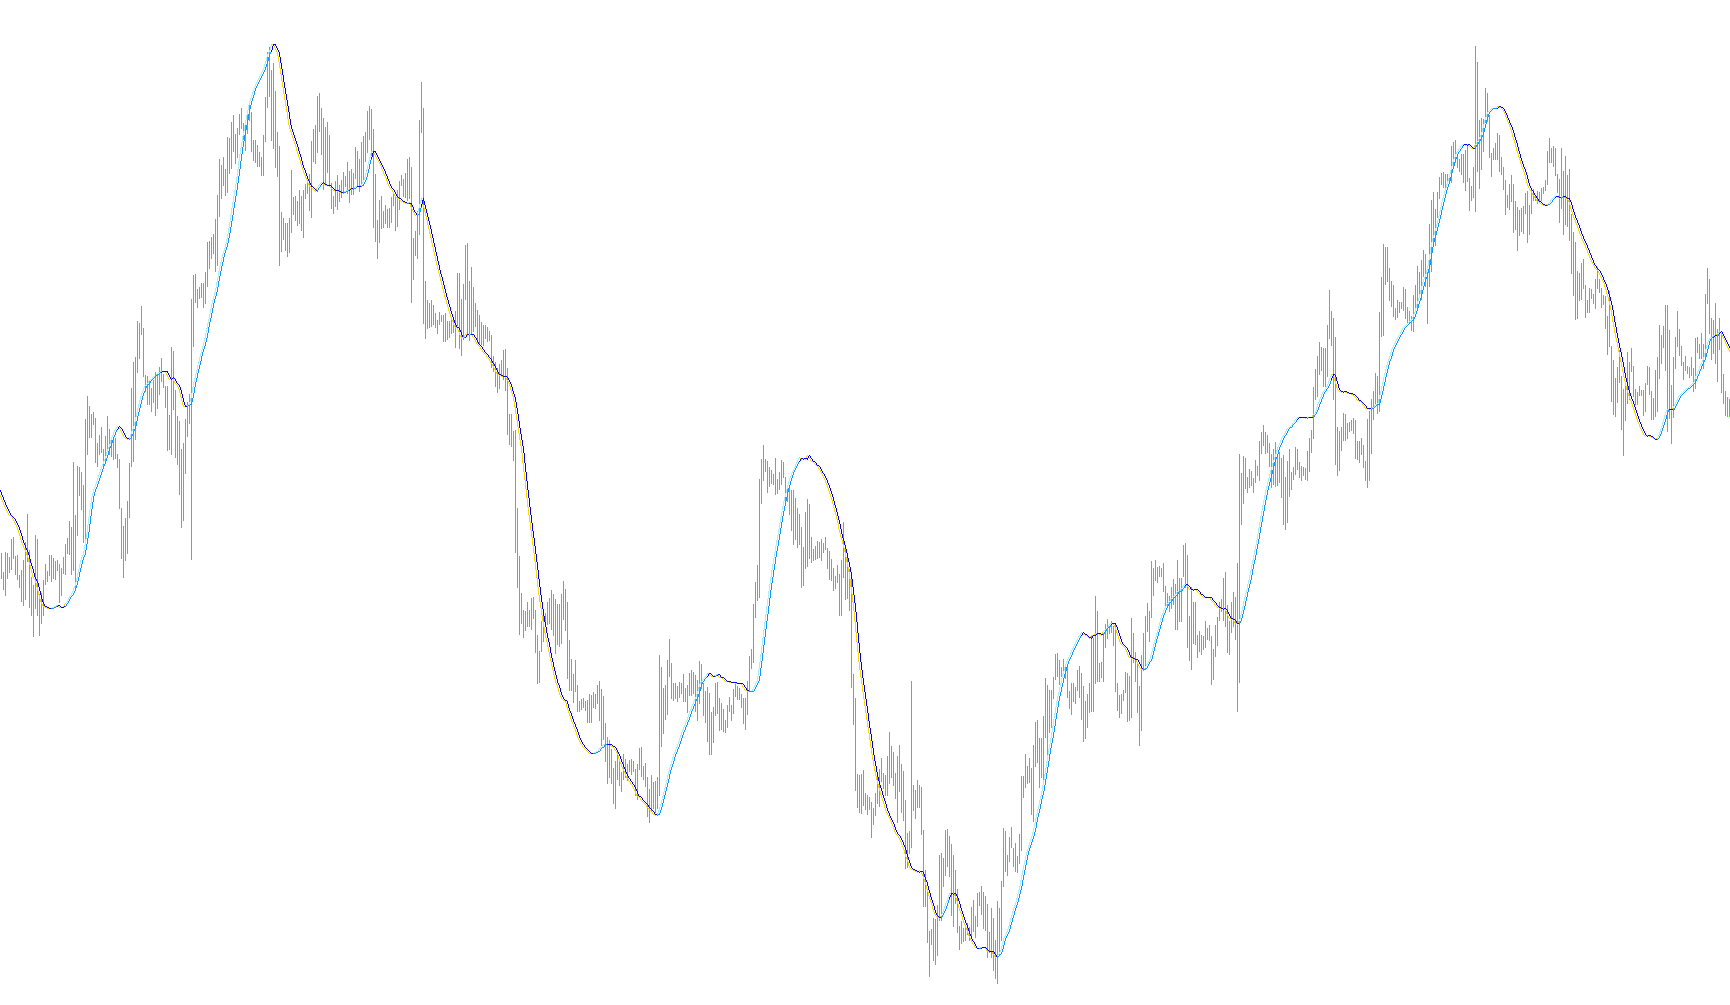
The "Trigger Line" indicator is designed to provide traders with a visual representation of market momentum and trend direction by analyzing price movements over a specific period. It functions by calculating two primary mathematical components: a weighted average and a smoothed moving average.
Core Mechanism
The logic operates by examining a set number of previous price points (defined by the user's period settings) to determine the current strength of the market. Instead of simply looking at the most recent price, the tool applies a "weighting" system. This means it gives different levels of importance to price data points within the timeframe, allowing the indicator to react more dynamically to significant moves while filtering out minor market noise.
Key Components
- Weighted Momentum: The script calculates a specific weighted value based on the closing prices. This serves as a primary signal for the current trend's velocity.
- Linear Smoothing: To prevent the data from becoming too erratic, the tool applies a "Linearly Weighted Moving Average" (LSMA). This smooths out the raw momentum data, making it easier for a trader to identify the underlying direction of the market without being distracted by sudden, temporary spikes.
Visual Logic and Interpretation
The indicator translates these complex calculations into four distinct visual lines on the chart, which behave based on their mathematical relationship to one another:
- Trend Filtering: The primary purpose of the logic is to compare the weighted momentum against its smoothed average.
- Dynamic Visibility: One of the unique features of this script is its conditional visibility. When the market shows a specific directional strength (where the weighted value is greater than the smoothed average), certain lines appear on the chart.
- Signal Suppression: If the current price momentum falls below the smoothed average, the indicator intentionally hides those specific visual lines (setting them to "empty"). This effectively cleans up the chart, ensuring that the trader only sees active signals during the periods that meet the tool's predefined criteria for trend strength.
In summary, this script acts as a sophisticated filter. It processes historical price data to find momentum, smooths that data to identify trends, and then visually presents those results only when the market confirms a specific directional movement.
/*-----------------------------+
|			       |
| Shared by www.Aptrafx.com    |
|			       |
+------------------------------*/

//+------------------------------------------------------------------+
//|                                                     Trigger Line |
//|                             Copyright © 2005 dwt5 and adoleh2000 |
//|                                        http://www.metaquotes.net |
//+------------------------------------------------------------------+
#property  copyright "Copyright © 2005 dwt5 and adoleh2000 "
#property  link      "http://www.metaquotes.net/"

//---- indicator settings
#property  indicator_chart_window
#property  indicator_buffers 4
#property indicator_color1 Red
#property indicator_color2 Yellow
#property indicator_color3 HotPink
#property indicator_color4 Aqua

//---- buffers
double ExtMapBuffer1[];
double ExtMapBuffer2[];
double ExtMapBuffer3[];
double ExtMapBuffer4[];

int width;

extern int Rperiod = 50;
extern int LSMA_Period = 50;
int Draw4HowLong;
int shift;
int i;
int j;
int loopbegin;
int length;
int lsma_length;

double lengthvar;
double tmp ;
double tmp2 ;
double wt[];
double sum[];
double lsma_sum[];
double lsma_ma[];
double middle[];
int c;

//+------------------------------------------------------------------+
//| Custom indicator initialization function                         |
//+------------------------------------------------------------------+
int init()
  {
//---- 7 additional buffers are used for counting.
   IndicatorBuffers(7);

//---- drawing settings

   SetIndexBuffer(0,ExtMapBuffer1);
   SetIndexStyle(0,DRAW_LINE,STYLE_SOLID,1);

   SetIndexBuffer(1,ExtMapBuffer2);
   SetIndexStyle(1,DRAW_LINE,STYLE_SOLID,1);

   SetIndexBuffer(2,ExtMapBuffer3);
   SetIndexStyle(2,DRAW_LINE,STYLE_SOLID,1);

   SetIndexBuffer(3,ExtMapBuffer4);
   SetIndexStyle(3,DRAW_LINE,STYLE_SOLID,1);


   SetIndexBuffer(4,sum);
   SetIndexBuffer(5,wt);
   SetIndexBuffer(6,lsma_ma);

//---- initialization done
   return(0);
  }

int start()

  {   Draw4HowLong = Bars-Rperiod - 5;                            //Rperiod = 20
      length = Rperiod;                                           //length now = 20
      lsma_length = LSMA_Period;
      loopbegin = Draw4HowLong - length - 1;


      for(shift = loopbegin; shift >= 0; shift--)  //  MAIN For Loop
      {
         sum[1] = 0;
         for(i = length; i >= 1  ; i--)             //LSMA loop
         {
         lengthvar = length + 1;                               //lengthvar = 21
         lengthvar /= 3;                                       //lengthvar = 7
         tmp = 0;
         tmp = ( i - lengthvar)*Close[length-i+shift];         //tmp = 20 - 7 * close[20-i+shift]
         sum[1]+=tmp;
         }
         wt[shift] = sum[1]*6/(length*(length+1));
         j = shift;
         lsma_ma[shift] = wt[j+1] + (wt[j]-wt[j+1])* 2/(lsma_length+1);


//========== COLOR CODING ===========================================


            ExtMapBuffer1[shift] = wt[shift];
            ExtMapBuffer2[shift] = lsma_ma[shift];
            ExtMapBuffer3[shift] = wt[shift];
            ExtMapBuffer4[shift] = lsma_ma[shift];


            if (wt[shift]  < lsma_ma[shift])
            {
                ExtMapBuffer4[shift] = EMPTY_VALUE;
                ExtMapBuffer3[shift] = EMPTY_VALUE;
           }

        }
  }
//+------------------------------------------------------------------+
Comments