$TrillionStrategySessions
Download script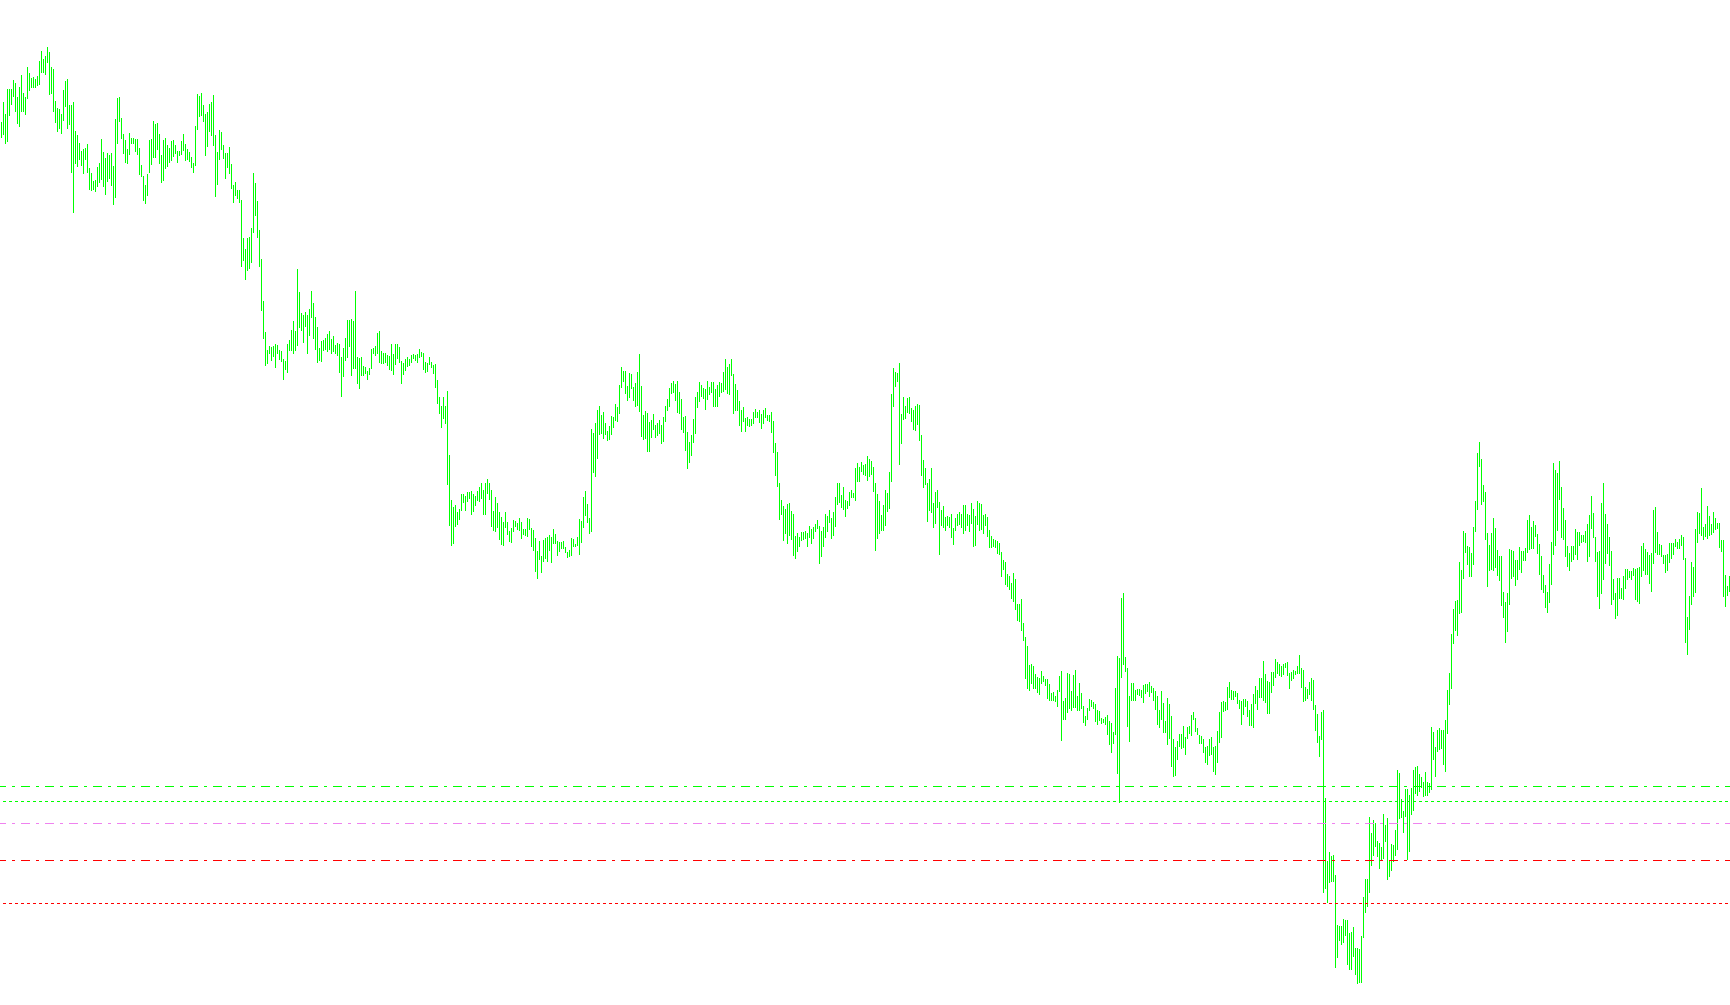
This script is designed to serve as a visual technical analysis tool for traders using the MetaTrader platform. It automatically identifies and plots key historical price levels on your trading chart, helping you visualize significant "turning points" or boundaries from previous trading sessions.
Core Functionality
The primary goal of the script is to calculate and display specific price levels based on yesterday's market activity. Instead of requiring a trader to manually look up historical data, it scans the recent history to find key figures such as the high, low, open, and close prices of previous sessions.
Key Features and Logic
-
Historical Data Tracking: The script monitors daily and hourly price movements. It specifically looks for "Yesterday's" data to establish a baseline for today’s trading environment. It identifies the exact moment the market opened and closed during the previous session to ensure accuracy.
-
Dynamic Pivot Calculations (ATM Pivots): The tool uses a specific set of logic to calculate "Pivot" levels. These are used to determine potential areas of support or resistance. The script calculates several variations:
- Range Analysis: It measures the total distance between yesterday's high and low.
- Support and Resistance Levels (R1, S1, R2, S2): Based on the previous day's range and closing price, it mathematically projects levels where the market might face pressure or find support.
- Midpoint Analysis: It calculates specific "High," "Low," and "Mid" points from the previous session.
-
Visual Overlay: Once these prices are calculated, the script draws them directly onto your chart as horizontal lines. To make the chart easy to read at a glance, it includes:
- Color-Coded Labels: It places text labels on the lines (such as "sH" for session high, "sL" for session low, and "Open/Close") so you can instantly identify what each line represents.
- Custom Styling: The lines are rendered with specific styles (like dots or dashed lines) and colors (such as Lime, Red, and Violet) to differentiate between different types of historical data.
-
User Customization: The logic includes toggle switches that allow the user to choose which specific data points they want to see. For example, you can choose whether to show the previous session's high/mid/low boundaries or just the opening and closing prices.
Summary for the Trader
In plain terms, this script acts as an automated "map" of yesterday’s price action. It takes the messy data from the previous day and simplifies it into a clean set of visual lines on your current chart. This allows you to see where the market was "held" or "rejected" yesterday, providing a clearer picture of where those levels might act as significant barriers in today's trading.
//+-------------------------------------------------------------------+
//|                                                                   |
//|                       Copyright © 2004, MetaQuotes Software Corp. |
//|                                         http://www.metaquotes.net |
//|                  tweaked by accrete at accrete.com                |
//+-------------------------------------------------------------------+
#property copyright "Copyright © 2004, MetaQuotes Software Corp."
#property link      "http://www.metaquotes.net"

#property indicator_chart_window

extern int Time_Shift=23;//set to = 16:00 New York on your broker feed

extern bool Previous_Session_H_M_L = true;
extern bool Show_Yesterdays_Close = true;
extern bool Show_Yesterdays_Open = true;


double Session_HML=0;
double day_high=0;
double day_low=0;
double yesterday_high=0;
double yesterday_open=0;
double yesterday_low=0;
double yesterday_close=0;
double today_open=0;
double today_high=0;
double today_low=0;
double P=0;//Prior Session Open
double Q=0;
double Y1; //Prior Session Close
double R1,R2,R3;
double M0,M1,M2,M3,M4,M5;
double S1,S2,S3;
double HBu6,HBu5,HBu4,HBu3,HBu2,HBu1;
double HBd6,HBd5,HBd4,HBd3,HBd2,HBd1;
double L4,L3;
double nQ=0;
double nD=0;
double D=0;
double rates_h1[2][6];
double rates_d1[2][6];
double PRICE;

//+------------------------------------------------------------------+
//| Custom indicator initialization function                         |
//+------------------------------------------------------------------+
int init()
  {
//---- indicators
 R1=0; R2=0; R3=0;
 M0=0; M1=0; M2=0; M3=0; M4=0; M5=0;
 S1=0; S2=0; S3=0;
 HBu6=0; HBu5=0; HBu4=0; HBu3=0; HBu2=0; HBu1=0;
 HBd6=0; HBd5=0; HBd4=0; HBd3=0; HBd2=0; HBd1=0;
 L4=0; L3=0;
 Y1=0;


//----
   return(0);
  }
//+------------------------------------------------------------------+
//| Custor indicator deinitialization function                       |
//+------------------------------------------------------------------+
int deinit()
  {
//---- TODO: add your code here
ObjectDelete("R1 Label");
ObjectDelete("R1 Line");
ObjectDelete("R2 Label");
ObjectDelete("R2 Line");
ObjectDelete("R3 Label");
ObjectDelete("R3 Line");
ObjectDelete("S1 Label");
ObjectDelete("S1 Line");
ObjectDelete("S2 Label");
ObjectDelete("S2 Line");
ObjectDelete("S3 Label");
ObjectDelete("S3 Line");
ObjectDelete("P Label");
ObjectDelete("P Line");
ObjectDelete("Y1 Label");
ObjectDelete("Y1 Line");


ObjectDelete("L3 Label");
ObjectDelete("L3 Line");
ObjectDelete("L4 Label");
ObjectDelete("L4 Line");
ObjectDelete("M5 Label");
ObjectDelete("M5 Line");
ObjectDelete("M4 Label");
ObjectDelete("M4 Line");
ObjectDelete("M3 Label");
ObjectDelete("M3 Line");
ObjectDelete("M2 Label");
ObjectDelete("M2 Line");
ObjectDelete("M1 Label");
ObjectDelete("M1 Line");
ObjectDelete("M0 Label");
ObjectDelete("M0 Line");
//----
   return(0);
  }
//+------------------------------------------------------------------+
//| Custom indicator iteration function                              |
//+------------------------------------------------------------------+
int start()
  {
      int i=0, j=0;
//---- TODO: add your code here

//---- exit if period is greater than daily charts
if(Period() > 1440)
{
Print("Error - Chart period is greater than 1 day.");
return(-1); // then exit
}

//---- Get new daily prices

ArrayCopyRates(rates_d1, Symbol(), PERIOD_D1);
yesterday_high = rates_d1[1][3];
yesterday_low = rates_d1[1][2];
day_high = rates_d1[0][3];
day_low = rates_d1[0][2];

ArrayCopyRates(rates_h1, Symbol(), PERIOD_H1);
for (i=0;i<=25;i++)
{
   if (TimeMinute(rates_h1[i][0])==0 && (TimeHour(rates_h1[i][0])-Time_Shift)==0)
   {
      yesterday_close = rates_h1[i+1][4];
      yesterday_open = rates_h1[i+24][1];
      today_open = rates_h1[i][1];
//      PRICE = (DoubleToStr(iMA(Symbol(),0,1,0,MODE_EMA,PRICE_CLOSE,0),Digits));//iMA(Symbol(),0,1,0,MODE_EMA,PRICE_CLOSE,0);

//      b  =MarketInfo(0,MODE_BID);
      break;
   }
}

//---- Calculate ATM_Pivots

D = (day_high - day_low);
Q = (yesterday_high - yesterday_low);
// P = yesterday_close;
R2 = yesterday_close+(Q*0.50);
R1 = yesterday_close+(Q*0.35);
S1 = yesterday_close-(Q*0.35);
S2 = yesterday_close-(Q*0.50);
//P = (yesterday_high + yesterday_low + yesterday_close) / 3; //original pivot code

// Previous Days High, Median, and Low:
M3 = (yesterday_high + yesterday_low)/2;
M2 = yesterday_low;
M1 = yesterday_high;
P = yesterday_open;
Y1 = yesterday_close;


//H4 = (Q*0.55)+yesterday_close;
// H3 = yesterday_close+(Q*0.125);
//R3 = (2*P)+(yesterday_high-(2*yesterday_low));

	/*Original R/S code:
	R1 = (2*P)-yesterday_low;
S1 = (2*P)-yesterday_high;
R2 = P+(yesterday_high - yesterday_low);
S2 = P-(yesterday_high - yesterday_low);
*/


//M5 = (R2+R3)/2;
//	R2 = P-S1+R1;
//M4 = (R1+R2)/2;
//	R1 = (2*P)-yesterday_low;
//M3 = (P+R1)/2;
//	P = (yesterday_high + yesterday_low + yesterday_close)/3;
//M2 = (P+S1)/2;
//	S1 = (2*P)-yesterday_high;
//M1 = (S1+S2)/2;
//	S2 = P-R1+S1;
//S3 = (2*P)-((2* yesterday_high)-yesterday_low);
//L3 = yesterday_close-(Q*0.27);
//L4 = yesterday_close-(Q*0.55);
//M0 = (S2+S3)/2;

if (Q > 5)
{
	nQ = Q;
}
else
{
	nQ = Q*10000;
}

if (D > 5)
{
	nD = D;
}
else
{
	nD = D*10000;
}
Comment("$TrillionStrategy           Prior Range = ",nQ,"        Current Range = ",nD, "\nSession Open = ", yesterday_open,"      Session Close = ",yesterday_close);

//---- Set line labels on chart window


//------ Midpoints ATM_Pivots

   if (Previous_Session_H_M_L==true)
   {

      if(ObjectFind("M3 label") != 0)
      {
      ObjectCreate("M3 label", OBJ_TEXT, 0, CurTime(), M3);
      ObjectSetText("M3 label", "                                              sM", 8, "Arial", Violet);
      }
      else
      {
      ObjectMove("M3 label", 0, CurTime(), M3);
      }

      if(ObjectFind("M2 label") != 0)
      {
      ObjectCreate("M2 label", OBJ_TEXT, 0, CurTime(), M2);
      ObjectSetText("M2 label", "                                              sL", 8, "Arial", Red);
      }
      else
      {
      ObjectMove("M2 label", 0, CurTime(), M2);
      }

      if(ObjectFind("M1 label") != 0)
      {
      ObjectCreate("M1 label", OBJ_TEXT, 0, CurTime(), M1);
      ObjectSetText("M1 label", "                                              sH", 8, "Arial", Lime);
      }
      else
      {
      ObjectMove("M1 label", 0, CurTime(), M1);
      }

      if(ObjectFind("M3 line") != 0)
      {
      ObjectCreate("M3 line", OBJ_HLINE, 0, Time[40], M3);
      ObjectSet("M3 line", OBJPROP_STYLE, STYLE_DASHDOT);
      ObjectSet("M3 line", OBJPROP_COLOR, Violet);
      }
      else
      {
      ObjectMove("M3 line", 0, Time[40], M3);
      }

      if(ObjectFind("M2 line") != 0)
      {
      ObjectCreate("M2 line", OBJ_HLINE, 0, Time[40], M2);
      ObjectSet("M2 line", OBJPROP_STYLE, STYLE_DASHDOT);
      ObjectSet("M2 line", OBJPROP_COLOR, Red);
      }
      else
      {
      ObjectMove("M2 line", 0, Time[40], M2);
      }

      if(ObjectFind("M1 line") != 0)
      {
      ObjectCreate("M1 line", OBJ_HLINE, 0, Time[40], M1);
      ObjectSet("M1 line", OBJPROP_STYLE, STYLE_DASHDOT);
      ObjectSet("M1 line", OBJPROP_COLOR, Lime);
      }
      else
      {
      ObjectMove("M1 line", 0, Time[40], M1);
      }
 }

    if (Show_Yesterdays_Close==true)
   {
           if(ObjectFind("P label") != 0)
      {
      ObjectCreate("P label", OBJ_TEXT, 0, CurTime(), P);
      ObjectSetText("P label", "                       Open", 8, "Arial", Lime);
      }
//price on line test:


//          ObjectSetText( "P label"," "+PRICE+ " " , 8, "Arial", Lime);
//          }
//end price on line test:
      else
      {
      ObjectMove("P label", 0, CurTime(), P);
      }
            if(ObjectFind("P line") != 0)
      {
      ObjectCreate("P line", OBJ_HLINE, 0, Time[40], P);
      ObjectSet("P line", OBJPROP_STYLE, STYLE_DOT);
      ObjectSet("P line", OBJPROP_COLOR, Lime);
      }
      else
      {
      ObjectMove("P line", 0, Time[40], P);
      }

}
 //------ Show Yesterday's Open:

 if ( Show_Yesterdays_Open==true)
   {
           if(ObjectFind("Y1 label") != 0)
      {
      ObjectCreate("Y1 label", OBJ_TEXT, 0, CurTime(), Y1);
      ObjectSetText("Y1 label", "                       Close", 8, "Arial", Red);
      }
      else
      {
      ObjectMove("Y1 label", 0, CurTime(), Y1);
      }
            if(ObjectFind("Y1 line") != 0)
      {
      ObjectCreate("Y1 line", OBJ_HLINE, 0, Time[40], Y1);
      ObjectSet("Y1 line", OBJPROP_STYLE, STYLE_DOT);
      ObjectSet("Y1 line", OBJPROP_COLOR, Red);
      }
      else
      {
      ObjectMove("Y1 line", 0, Time[40], Y1);
      }

}
//----End of Midpoint Pivots Draw

//---- End Of Program
   return(0);
  }
//+------------------------------------------------------------------+
Comments