$TrillionStrategySessions_v1
Download script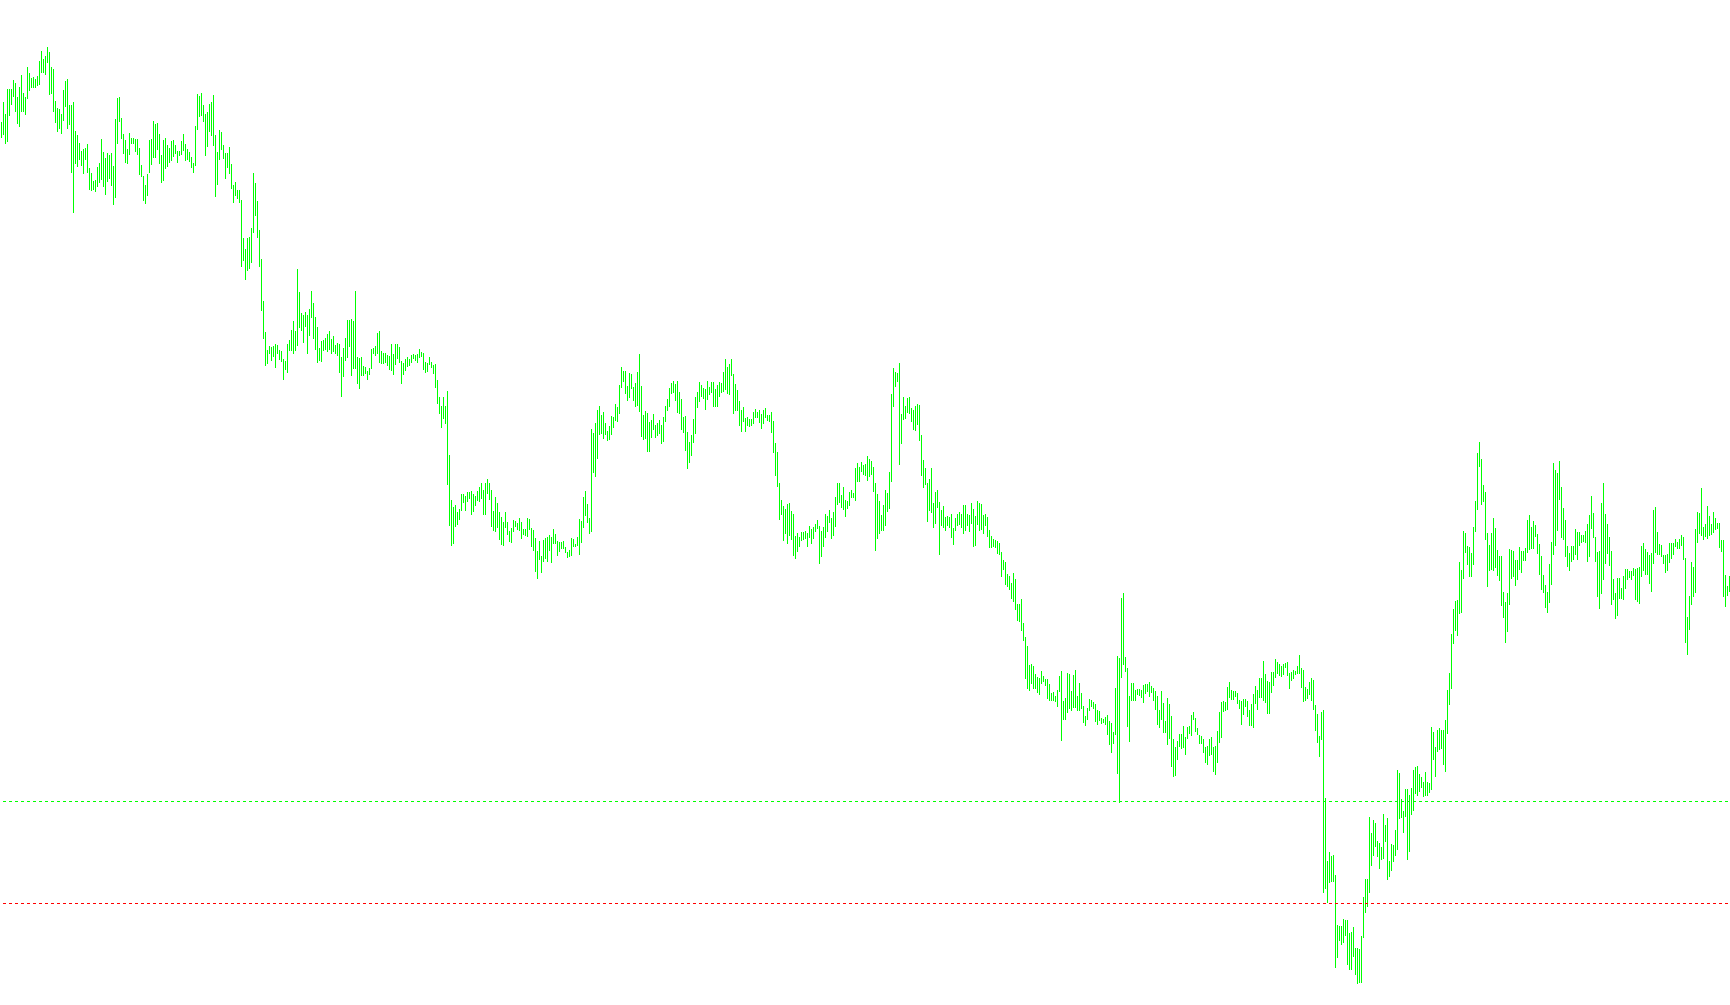
This script is designed to automatically calculate and display significant price levels on a trading chart based on historical market data. It acts as a visual roadmap, highlighting specific price points from previous sessions to help traders identify potential areas of support, resistance, or trend shifts.
Core Functionality
The tool operates by analyzing the price action of the previous day and the current day to derive three main categories of information:
1. Historical Price Points The script identifies and draws horizontal lines for key milestones from the previous trading session:
- Yesterday's Open: The specific price where the market began the previous day.
- Yesterday's Close: The final price at which the market ended the previous day.
2. Session Range Calculations (Midpoints) A significant portion of the logic focuses on "Session Midpoints." By calculating the distance between yesterday's high and low, the script identifies:
- High Midpoint (sH): The upper boundary of the previous session's range.
- Low Midpoint (sL): The lower boundary of the previous session's range.
- Session Median (sM): The exact middle point between yesterday's high and low.
These levels are visually distinguished on the chart with specific colors (Lime for highs, Red for lows, and Violet for the median) to provide a clear sense of where the price has behaved historically.
3. Dynamic Pivot Levels The script uses a custom mathematical formula (often referred to as "ATM Pivots") to project potential levels for the current session. It calculates several Support (S) and Resistance (R) levels based on:
- The percentage distance of yesterday's range.
- The relationship between yesterday's close and its total price movement.
Visual and Data Output
- On-Chart Labels: The script automatically places text labels (such as "Open," "Close," "sH," "sL," and "sM") on the chart so that a trader can immediately identify what each line represents without guessing.
- Automated Drawing: It handles all the heavy lifting of creating, moving, and updating these lines in real-time as new price data arrives.
- Data Dashboard: In the top corner of the screen, the script provides a text summary showing the "Prior Range" (how much the market moved yesterday) versus the "Current Range" (how much it has moved today), alongside the specific session open and close prices.
Operational Constraints
For the logic to function correctly, the user must be viewing a timeframe of one day or less (e.g., Hourly, 15-minute, etc.). If a larger timeframe is used, the script will notify the user that it cannot calculate the necessary daily data.
//+-------------------------------------------------------------------+
//|                                                                   |
//|                       Copyright © 2004, MetaQuotes Software Corp. |
//|                                         http://www.metaquotes.net |
//|                  tweaked by accrete at accrete.com                |
//+-------------------------------------------------------------------+
#property copyright "Copyright © 2004, MetaQuotes Software Corp."
#property link      "http://www.metaquotes.net"

#property indicator_chart_window

extern int Time_Shift=23;//set to = 16:00 New York on your broker feed

extern bool Previous_Session_H_M_L = false;
extern bool Show_Yesterdays_Close = true;
extern bool Show_Yesterdays_Open = true;


double Session_HML=0;
double day_high=0;
double day_low=0;
double yesterday_high=0;
double yesterday_open=0;
double yesterday_low=0;
double yesterday_close=0;
double today_open=0;
double today_high=0;
double today_low=0;
double P=0;//Prior Session Open
double Q=0;
double Y1; //Prior Session Close
double R1,R2,R3;
double M0,M1,M2,M3,M4,M5;
double S1,S2,S3;
double HBu6,HBu5,HBu4,HBu3,HBu2,HBu1;
double HBd6,HBd5,HBd4,HBd3,HBd2,HBd1;
double L4,L3;
double nQ=0;
double nD=0;
double D=0;
double rates_h1[2][6];
double rates_d1[2][6];

//+------------------------------------------------------------------+
//| Custom indicator initialization function                         |
//+------------------------------------------------------------------+
int init()
  {
//---- indicators
 R1=0; R2=0; R3=0;
 M0=0; M1=0; M2=0; M3=0; M4=0; M5=0;
 S1=0; S2=0; S3=0;
 HBu6=0; HBu5=0; HBu4=0; HBu3=0; HBu2=0; HBu1=0;
 HBd6=0; HBd5=0; HBd4=0; HBd3=0; HBd2=0; HBd1=0;
 L4=0; L3=0;
 Y1=0;


//----
   return(0);
  }
//+------------------------------------------------------------------+
//| Custor indicator deinitialization function                       |
//+------------------------------------------------------------------+
int deinit()
  {
//---- TODO: add your code here
ObjectDelete("R1 Label");
ObjectDelete("R1 Line");
ObjectDelete("R2 Label");
ObjectDelete("R2 Line");
ObjectDelete("R3 Label");
ObjectDelete("R3 Line");
ObjectDelete("S1 Label");
ObjectDelete("S1 Line");
ObjectDelete("S2 Label");
ObjectDelete("S2 Line");
ObjectDelete("S3 Label");
ObjectDelete("S3 Line");
ObjectDelete("P Label");
ObjectDelete("P Line");
ObjectDelete("Y1 Label");
ObjectDelete("Y1 Line");


ObjectDelete("L3 Label");
ObjectDelete("L3 Line");
ObjectDelete("L4 Label");
ObjectDelete("L4 Line");
ObjectDelete("M5 Label");
ObjectDelete("M5 Line");
ObjectDelete("M4 Label");
ObjectDelete("M4 Line");
ObjectDelete("M3 Label");
ObjectDelete("M3 Line");
ObjectDelete("M2 Label");
ObjectDelete("M2 Line");
ObjectDelete("M1 Label");
ObjectDelete("M1 Line");
ObjectDelete("M0 Label");
ObjectDelete("M0 Line");
//----
   return(0);
  }
//+------------------------------------------------------------------+
//| Custom indicator iteration function                              |
//+------------------------------------------------------------------+
int start()
  {
      int i=0, j=0;
//---- TODO: add your code here

//---- exit if period is greater than daily charts
if(Period() > 1440)
{
Print("Error - Chart period is greater than 1 day.");
return(-1); // then exit
}

//---- Get new daily prices

ArrayCopyRates(rates_d1, Symbol(), PERIOD_D1);
yesterday_high = rates_d1[1][3];
yesterday_low = rates_d1[1][2];
day_high = rates_d1[0][3];
day_low = rates_d1[0][2];

ArrayCopyRates(rates_h1, Symbol(), PERIOD_H1);
for (i=0;i<=25;i++)
{
   if (TimeMinute(rates_h1[i][0])==0 && (TimeHour(rates_h1[i][0])-Time_Shift)==0)
   {
      yesterday_close = rates_h1[i+1][4];
      yesterday_open = rates_h1[i+24][1];
      today_open = rates_h1[i][1];
      break;
   }
}

//---- Calculate ATM_Pivots

D = (day_high - day_low);
Q = (yesterday_high - yesterday_low);
// P = yesterday_close;
R2 = yesterday_close+(Q*0.50);
R1 = yesterday_close+(Q*0.35);
S1 = yesterday_close-(Q*0.35);
S2 = yesterday_close-(Q*0.50);
//P = (yesterday_high + yesterday_low + yesterday_close) / 3; //original pivot code

// Previous Days High, Median, and Low:
M3 = (yesterday_high + yesterday_low)/2;
M2 = yesterday_low;
M1 = yesterday_high;
P = yesterday_open;
Y1 = yesterday_close;


//H4 = (Q*0.55)+yesterday_close;
// H3 = yesterday_close+(Q*0.125);
//R3 = (2*P)+(yesterday_high-(2*yesterday_low));

	/*Original R/S code:
	R1 = (2*P)-yesterday_low;
S1 = (2*P)-yesterday_high;
R2 = P+(yesterday_high - yesterday_low);
S2 = P-(yesterday_high - yesterday_low);
*/


//M5 = (R2+R3)/2;
//	R2 = P-S1+R1;
//M4 = (R1+R2)/2;
//	R1 = (2*P)-yesterday_low;
//M3 = (P+R1)/2;
//	P = (yesterday_high + yesterday_low + yesterday_close)/3;
//M2 = (P+S1)/2;
//	S1 = (2*P)-yesterday_high;
//M1 = (S1+S2)/2;
//	S2 = P-R1+S1;
//S3 = (2*P)-((2* yesterday_high)-yesterday_low);
//L3 = yesterday_close-(Q*0.27);
//L4 = yesterday_close-(Q*0.55);
//M0 = (S2+S3)/2;

if (Q > 5)
{
	nQ = Q;
}
else
{
	nQ = Q*10000;
}

if (D > 5)
{
	nD = D;
}
else
{
	nD = D*10000;
}
Comment("$TrillionStrategy           Prior Range = ",nQ,"        Current Range = ",nD, "\nSession Open = ", yesterday_open,"      Session Close = ",yesterday_close);

//---- Set line labels on chart window


//------ Midpoints ATM_Pivots

   if (Previous_Session_H_M_L==true)
   {

      if(ObjectFind("M3 label") != 0)
      {
      ObjectCreate("M3 label", OBJ_TEXT, 0, CurTime(), M3);
      ObjectSetText("M3 label", "                                              sM", 8, "Arial", Violet);
      }
      else
      {
      ObjectMove("M3 label", 0, CurTime(), M3);
      }

      if(ObjectFind("M2 label") != 0)
      {
      ObjectCreate("M2 label", OBJ_TEXT, 0, CurTime(), M2);
      ObjectSetText("M2 label", "                                              sL", 8, "Arial", Red);
      }
      else
      {
      ObjectMove("M2 label", 0, CurTime(), M2);
      }

      if(ObjectFind("M1 label") != 0)
      {
      ObjectCreate("M1 label", OBJ_TEXT, 0, CurTime(), M1);
      ObjectSetText("M1 label", "                                              sH", 8, "Arial", Lime);
      }
      else
      {
      ObjectMove("M1 label", 0, CurTime(), M1);
      }

      if(ObjectFind("M3 line") != 0)
      {
      ObjectCreate("M3 line", OBJ_HLINE, 0, Time[40], M3);
      ObjectSet("M3 line", OBJPROP_STYLE, STYLE_DASHDOT);
      ObjectSet("M3 line", OBJPROP_COLOR, Violet);
      }
      else
      {
      ObjectMove("M3 line", 0, Time[40], M3);
      }

      if(ObjectFind("M2 line") != 0)
      {
      ObjectCreate("M2 line", OBJ_HLINE, 0, Time[40], M2);
      ObjectSet("M2 line", OBJPROP_STYLE, STYLE_DASHDOT);
      ObjectSet("M2 line", OBJPROP_COLOR, Red);
      }
      else
      {
      ObjectMove("M2 line", 0, Time[40], M2);
      }

      if(ObjectFind("M1 line") != 0)
      {
      ObjectCreate("M1 line", OBJ_HLINE, 0, Time[40], M1);
      ObjectSet("M1 line", OBJPROP_STYLE, STYLE_DASHDOT);
      ObjectSet("M1 line", OBJPROP_COLOR, Lime);
      }
      else
      {
      ObjectMove("M1 line", 0, Time[40], M1);
      }
 }

    if (Show_Yesterdays_Close==true)
   {
           if(ObjectFind("P label") != 0)
      {
      ObjectCreate("P label", OBJ_TEXT, 0, CurTime(), P);
      ObjectSetText("P label", "                       Open", 8, "Arial", Lime);
      }
      else
      {
      ObjectMove("P label", 0, CurTime(), P);
      }
            if(ObjectFind("P line") != 0)
      {
      ObjectCreate("P line", OBJ_HLINE, 0, Time[40], P);
      ObjectSet("P line", OBJPROP_STYLE, STYLE_DOT);
      ObjectSet("P line", OBJPROP_COLOR, Lime);
      }
      else
      {
      ObjectMove("P line", 0, Time[40], P);
      }

}
 //------ Show Yesterday's Open:

 if ( Show_Yesterdays_Open==true)
   {
           if(ObjectFind("Y1 label") != 0)
      {
      ObjectCreate("Y1 label", OBJ_TEXT, 0, CurTime(), Y1);
      ObjectSetText("Y1 label", "                       Close", 8, "Arial", Red);
      }
      else
      {
      ObjectMove("Y1 label", 0, CurTime(), Y1);
      }
            if(ObjectFind("Y1 line") != 0)
      {
      ObjectCreate("Y1 line", OBJ_HLINE, 0, Time[40], Y1);
      ObjectSet("Y1 line", OBJPROP_STYLE, STYLE_DOT);
      ObjectSet("Y1 line", OBJPROP_COLOR, Red);
      }
      else
      {
      ObjectMove("Y1 line", 0, Time[40], Y1);
      }

}
//----End of Midpoint Pivots Draw

//---- End Of Program
   return(0);
  }
//+------------------------------------------------------------------+
Comments