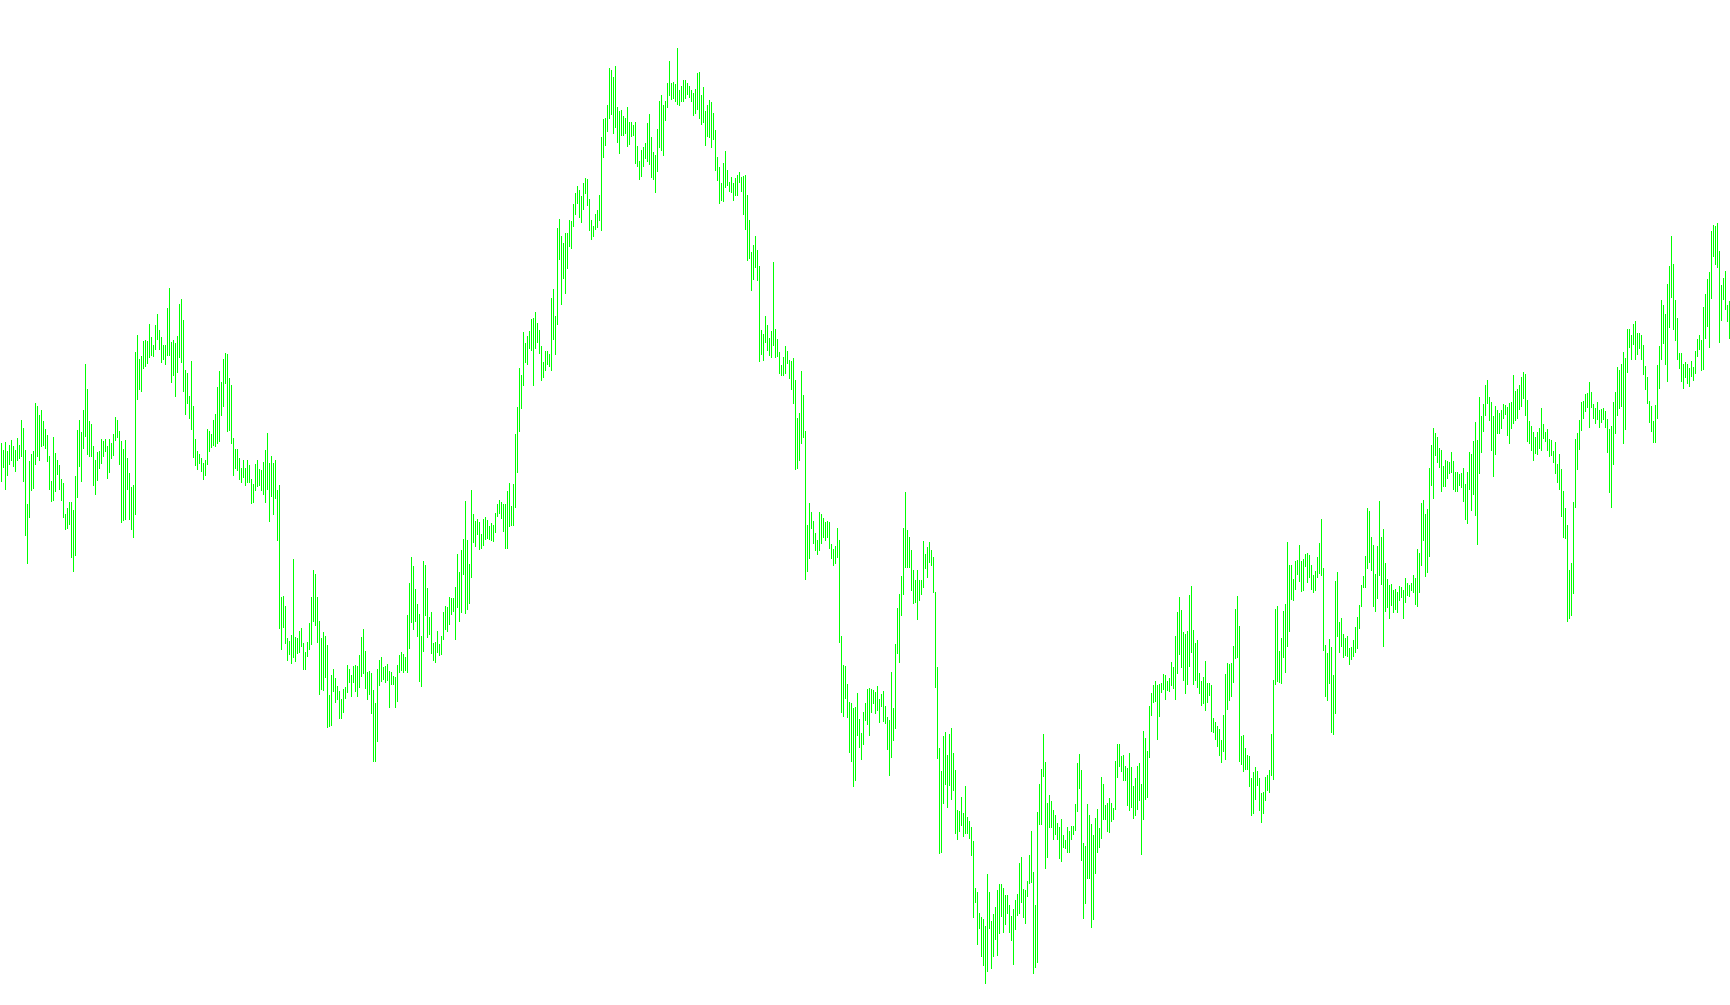
The TRO Range indicator is designed to help traders visualize and monitor market volatility by measuring the price movement within specific timeframes. Instead of looking at standard price candles on a main chart, this tool creates a dedicated sub-window that focuses exclusively on the "size" of each candle's range.
How it Works
The logic behind the script is based on calculating the distance between the highest and lowest prices reached during a single trading period (such as a minute, hour, or day, depending on your chart settings). By subtracting the low price from the high price, the tool determines the total "spread" or range for that specific bar.
Key Features
- Visual Range Mapping: The indicator translates these price differences into a histogram format. This allows you to see at a glance whether the market is moving aggressively or remains relatively still.
- Threshold Monitoring: The script includes a customizable "Threshold" setting. This acts as a benchmark for volatility. When the price range exceeds this specific limit, the tool highlights those instances differently, making it easier to identify periods of significant market expansion or high-impact news events.
- Real-Time Tracking: The indicator provides a dynamic visual update for the current live bar. It projects a horizontal line and a label that show exactly how far the price has traveled from its session low to its session high in real-time, helping traders gauge momentum as it unfolds.
Practical Application
By using this tool, you can quickly filter out "quiet" market activity and focus on bars that meet your specific criteria for volatility. It serves as a visual barometer for market energy, providing a clear distinction between standard price fluctuations and significant price swings.
//+-------------------------------------------------------------------+
//|                                        _TRO_RANGE.mq4              |
//|                                                         TRO, 2007 |
//|                                modified by Skyline on 22 Nov 2007 |
//+-------------------------------------------------------------------+
#property  copyright "Copyright ? 2007, Avery T. Horton, Jr. aka TRO"
#property  link      "http://www.therumpldone.com/"


//---- indicator settings
#property  indicator_separate_window
#property  indicator_buffers 2
#property  indicator_color1  Red
#property  indicator_color2  Green

//---- indicator buffers
double     RANGEBuffer[];
double     RANGEBuffer1[];

//---- indicator parameters
extern int   Threshold=20;
extern color CurrentBarColor = White;
extern color ThresholdColor  = Aqua;

//+------------------------------------------------------------------+
//| Custom indicator initialization function                         |
//+------------------------------------------------------------------+
int init()
  {

//---- drawing settings
   SetIndexStyle(0,DRAW_HISTOGRAM,STYLE_SOLID,2);
   SetIndexStyle(1,DRAW_HISTOGRAM,STYLE_SOLID,2);
//---- indicator buffers mapping
   SetIndexBuffer(0,RANGEBuffer);
   SetIndexBuffer(1,RANGEBuffer1);
//---- name for DataWindow and indicator subwindow label
   IndicatorShortName("RANGE");
   SetIndexLabel(0,"RANGE");
   SetIndexLabel(1,"RANGE");

//---- initialization done
   return(0);
  }
int deinit()
{
   ObjectDelete("CurrentBarValue");
   ObjectDelete("LabelCurrentBarValue");
}
//+------------------------------------------------------------------+
//| Range                                                            |
//+------------------------------------------------------------------+
int start()
  {
   double HighVal,LowVal;
   int limit;
   int counted_bars=IndicatorCounted();
//---- last counted bar will be recounted
  if(counted_bars>0) counted_bars--;
  limit=Bars-counted_bars;
//---- RANGE counted in the 1-st buffer
   for(int i=0; i<limit; i++)
   {
     HighVal  = iHigh(NULL,0,i);
     LowVal   = iLow(NULL,0,i);
     if ((HighVal-LowVal)/Point >= Threshold) { RANGEBuffer1[i] = (HighVal-LowVal)/Point; }
     else { RANGEBuffer[i] = (HighVal-LowVal)/Point; }

     // Draw Threshold line
     int win_idx=WindowFind("RANGE");

/*
     ObjectDelete("Threshold");
     ObjectCreate("Threshold", OBJ_HLINE, win_idx, Time[0], Threshold);
     ObjectSet("Threshold", OBJPROP_COLOR, ThresholdColor);
     ObjectSet("Threshold", OBJPROP_STYLE, STYLE_SOLID);
     ObjectSet("Threshold", OBJPROP_WIDTH, 1);
     ObjectSet("Threshold", OBJPROP_BACK, true);

     // Label for Threshold
//     ObjectDelete("LabelThreshold");
//     ObjectCreate("LabelThreshold", OBJ_TEXT, win_idx, Time[0], Threshold);
     ObjectSet("LabelThreshold", OBJPROP_COLOR, ThresholdColor);
     ObjectSetText("LabelThreshold", "Threshold",8);
    ObjectSet("LabelThreshold", OBJPROP_ANGLE, 0);
*/
     // Draw Current Bar line value
     ObjectDelete("CurrentBarValue");
     ObjectCreate("CurrentBarValue", OBJ_HLINE, win_idx, Time[0], (iHigh(NULL,0,0)-iLow(NULL,0,0))/Point);
     ObjectSet("CurrentBarValue", OBJPROP_COLOR, CurrentBarColor);
     ObjectSet("CurrentBarValue", OBJPROP_STYLE, STYLE_SOLID);
     ObjectSet("CurrentBarValue", OBJPROP_WIDTH, 1);
     ObjectSet("CurrentBarValue", OBJPROP_BACK, true);

     // Label per Current Bar Line
//     ObjectDelete("LabelCurrentBarValue");
//     ObjectCreate("LabelCurrentBarValue", OBJ_TEXT, win_idx, Time[0], (iHigh(NULL,0,0)-iLow(NULL,0,0))/Point);
     ObjectSet("LabelCurrentBarValue", OBJPROP_COLOR, CurrentBarColor);
     ObjectSetText("LabelCurrentBarValue", "Current Bar value",8);
     ObjectSet("LabelCurrentBarValue", OBJPROP_ANGLE, 0);
   }

//---- done
   return(0);
  }
Comments