TTF_TR_v2
Download script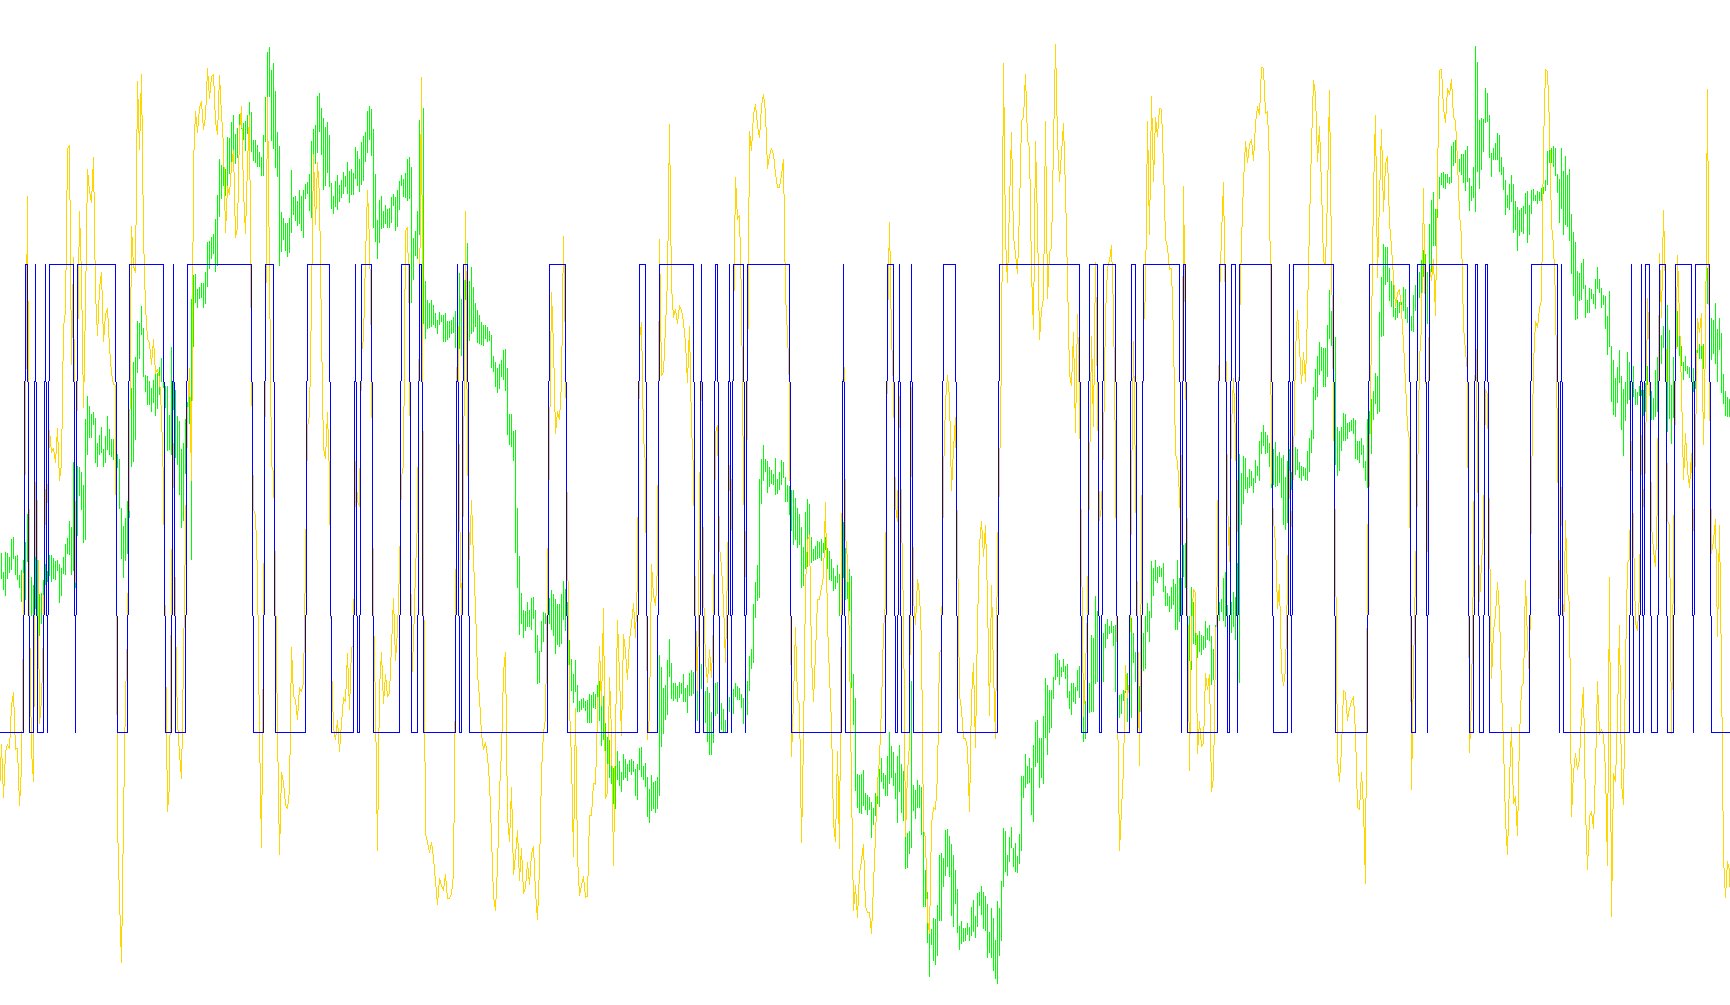
The Trendscalp indicator is designed to provide traders with a clear, visual representation of market momentum by analyzing price extremes over specific timeframes. Unlike some indicators that might "repaint" (change past data) or smooth out information to the point of losing detail, this script focuses on raw price action to determine whether the current trend is leaning toward a bullish or bearish sentiment.
How the Logic Works
The core functionality revolves around comparing "Recent" price action against "Older" price action within a user-defined window of bars (defaulting to 15). Here is the step-by-step breakdown of how it processes data:
1. Identifying Price Extremes For every point on the chart, the script identifies four key price points:
- Recent Highs/Lows: The highest and lowest prices reached in the immediate past (the very last bar).
- Older Highs/Lows: The highest and lowest prices reached over the broader look-back period (the 15-bar window).
2. Calculating Market Power The script then calculates two distinct "Power" scores:
- Buy Power: This measures the distance between the most recent high and the older low. A larger gap suggests stronger upward momentum.
- Sell Power: This measures the distance between the older high and the most recent low. A larger gap suggests stronger downward pressure.
3. Determining the Trend (The %K Line) By comparing these two power scores against each other, the indicator produces a percentage value. This calculation essentially asks: "Is the strength of the current move significantly greater than the opposition?"
- This results in the Main Buffer, which creates a fluctuating line showing the relative strength of the trend.
4. The Signal Mechanism To make this data actionable for a trader, the script generates a secondary signal line based on the resulting percentage:
- If the calculated trend strength is positive (above zero), the signal identifies an upward bias.
- If the trend strength falls below zero, the signal indicates a downward bias.
Summary for Traders
In essence, this tool strips away the "noise" of minor price fluctuations and looks at the relationship between recent price peaks and older price valleys. It allows you to see whether the market is currently gaining "Buy Power" or "Sell Power" relative to its recent history, providing a streamlined way to identify the prevailing direction of the trend.
//+------------------------------------------------------------------+
//|                                       Trendscalpindic.mq4        |
//|                        Based on Nick Beluk's TTF implementation  |
//|                        No redrawing, no lookahead, nosmoothing   |
//+------------------------------------------------------------------+
#property copyright "Copyright © 2005, Nick Bilak"
#property link      "beluck[at]gmail.com"

#property indicator_separate_window
#property indicator_buffers 2
#property indicator_color1 LightSeaGreen
#property indicator_color2 Red
//---- input parameters
extern int TTFbars=15;
//15=default number of bars for computation
//---- buffers
double MainBuffer[];
double SignalBuffer[];
//----
int TopLine=100;
int BottomLine=-100;
int draw_begin1=0;
int draw_begin2=0;
double  HighestHighRecent=0;
double  HighestHighOlder =0;
double  LowestLowRecent =0;
double  LowestLowOlder =0;
double  BuyPower =0;
double  SellPower=0;
double  TTF=0;

//+------------------------------------------------------------------+
//| Custom indicator initialization function                         |
//+------------------------------------------------------------------+
int init()
  {
   string short_name;
//---- 2 additional buffers are used for counting.
   IndicatorBuffers(2);
//---- indicator lines
   SetIndexStyle(0,DRAW_LINE);
   SetIndexBuffer(0, MainBuffer);
   SetIndexStyle(1,DRAW_LINE);
   SetIndexBuffer(1, SignalBuffer);
//---- name for DataWindow and indicator subwindow label
   short_name="TTF_TR("+TTFbars+")";
   IndicatorShortName(short_name);
   SetIndexLabel(0,short_name);
   SetIndexLabel(1,"Signal");
//----
   draw_begin1=TTFbars*2+1;
   draw_begin2=draw_begin1;
   SetIndexDrawBegin(0,draw_begin1);
   SetIndexDrawBegin(1,draw_begin2);

//----
   return(0);
  }
//+------------------------------------------------------------------+
//| ttf                                            |
//+------------------------------------------------------------------+
int start()
  {
   int    i,k;
   int    counted_bars=IndicatorCounted();
   double price;
//----
   if(Bars<=draw_begin2) return(0);
//---- initial zero
   if(counted_bars<1)
     {
      for(i=1;i<=draw_begin1;i++) MainBuffer[Bars-i]=0;
      for(i=1;i<=draw_begin2;i++) SignalBuffer[Bars-i]=0;
     }
//---- %K line
   i=Bars-draw_begin1;
   if(counted_bars>draw_begin1) i=Bars-counted_bars-1;
   while(i>=0)
     {
      HighestHighRecent=High[Highest(Symbol(), 0, MODE_HIGH,1,i)];
      HighestHighOlder=High[Highest(Symbol(), 0, MODE_HIGH,TTFbars,i+1)];
      LowestLowRecent=Low [Lowest (Symbol(), 0, MODE_LOW,1,i)];
      LowestLowOlder=Low [Lowest (Symbol(), 0, MODE_LOW,TTFbars,i+1)];
      BuyPower=HighestHighRecent-LowestLowOlder;
      SellPower=HighestHighOlder-LowestLowRecent;
      TTF=(BuyPower-SellPower)/(0.5*(BuyPower+SellPower))*100;
      //Print (Time[i], "   ", HighestHighRecent, ",  ",HighestHighOlder, ",  ", LowestLowRecent, ",  ",LowestLowOlder    );

      MainBuffer[i]=TTF;
      i--;
     }
//---- last counted bar will be recounted
   if(counted_bars>0) counted_bars--;
   int limit=Bars-counted_bars;
//---- signal line is simple movimg average
     for(i=0; i<limit; i++) {
      if (MainBuffer[i]>=0)
         SignalBuffer[i]=TopLine;
      else
         SignalBuffer[i]=BottomLine;
     }
//----
   return(0);
  }
//+------------------------------------------------------------------+
Comments