V-T&B
Download script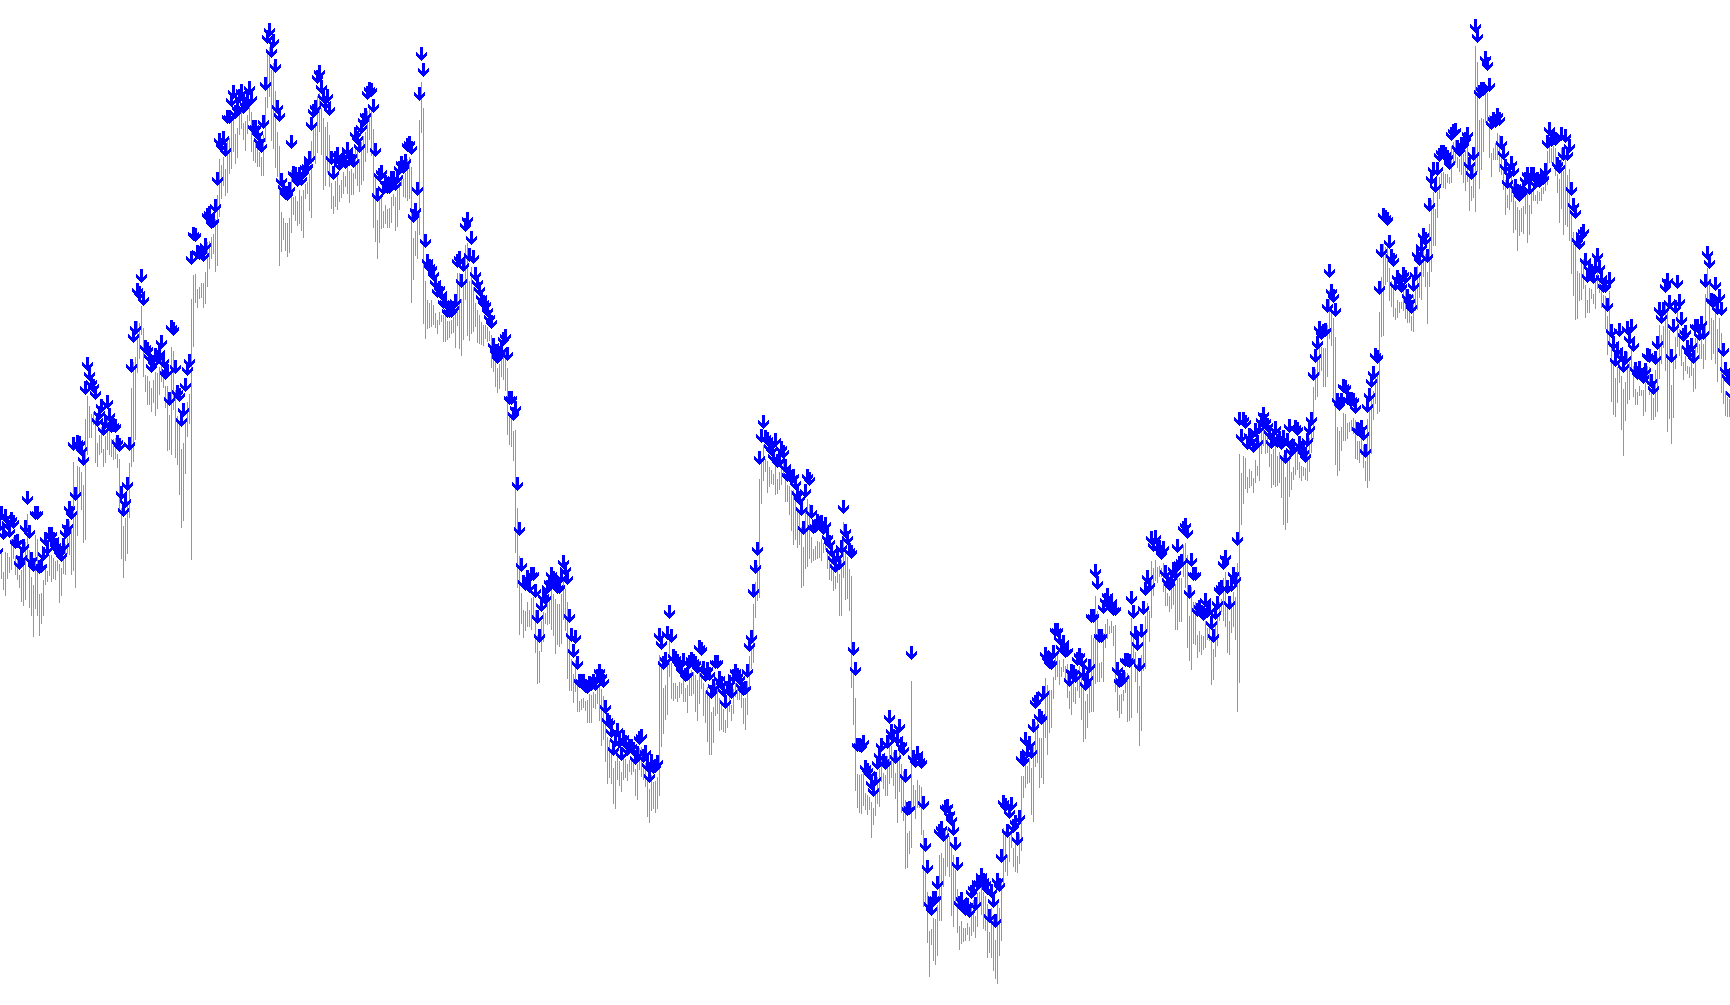
This tool is designed to act as a visual aid for traders who want to identify significant turning points in price action by highlighting specific candlestick behaviors. Rather than using complex mathematical formulas, the script focuses on the physical "shape" of the candles to determine where the market might be exhausting its momentum.
How the Logic Works
The script analyzes each candle on your chart by looking at three primary components: the body (the space between the opening and closing price), the upper wick (the thin line above the body), and the lower wick (the thin line below the body).
It operates through a three-step process:
1. Measuring Market Volatility Before making any decisions, the tool calculates the "Average Range" of the market. It looks at the last 10 candles to determine the typical size of price movements. This is important because it ensures that the signals are scaled correctly based on whether the market is currently moving in small increments or large swings.
2. Identifying Candle Shapes The script then examines the most recent candle to see how the price moved during that specific period. It categorizes the movement into two main scenarios:
- Upper Wick Detection: It looks for candles where the "tail" on top is significantly longer than the actual body of the candle. This suggests that buyers tried to push the price up, but were met with heavy selling pressure, pushing the price back down.
- Lower Wick Detection: It looks for candles where the "tail" on the bottom is significantly longer than the body. This indicates that sellers tried to push the price down, but were met with strong buying interest, forcing the price back up.
3. Placing Visual Signals Once the script identifies these specific shapes, it places a visual marker on your chart:
- Top Signals: When a significant upper wick is detected (indicating potential overhead resistance), a signal appears slightly below the current price.
- Bottom Signals: When a significant lower wick is detected (indicating potential support from buyers), a signal appears slightly above the current price.
Summary for Traders
Essentially, this tool filters out the "noise" of standard price movement to point out moments where the market has encountered a wall. It highlights instances where the price tried to break in one direction but failed, potentially signaling a reversal or a pause in the current trend.
//+------------------------------------------------------------------+
//|                                                        V-T&B.mq4 |
//|                         Copyright © 2005, Don Lawson (don_forex) |
//+------------------------------------------------------------------+


#property copyright "Copyright © 2005, Don Lawson (don_forex)"
#property link      "d_n_d_enterprises@sbcglobal.net"

#property indicator_chart_window
#property indicator_buffers 2
#property indicator_color1 Green
#property indicator_color2 Red

double VTop[];
double VBottom[];
//+------------------------------------------------------------------+
//| Custom indicator initialization function                         |
//+------------------------------------------------------------------+
int init()
  {
//---- indicators
   SetIndexStyle(0, DRAW_ARROW, EMPTY);
   SetIndexArrow(0, 233);
   SetIndexBuffer(0, VTop);
   SetIndexStyle(1, DRAW_ARROW, EMPTY);
   SetIndexArrow(1, 234);
   SetIndexBuffer(1, VBottom);
//----
   return(0);
  }
//+------------------------------------------------------------------+
//| Custom indicator deinitialization function                       |
//+------------------------------------------------------------------+
int deinit()
  {
//----

//----
   return(0);
  }
//+------------------------------------------------------------------+
//| Custom indicator iteration function                              |
//+------------------------------------------------------------------+
int start() {
   int limit, i, counter;
   double Range, AvgRange;
   int counted_bars=IndicatorCounted();
//---- check for possible errors
   if(counted_bars<0) return(-1);
//---- last counted bar will be recounted
   if(counted_bars>0) counted_bars--;

   limit=Bars-counted_bars;

   for(i = 0; i <= limit; i++) {

      counter=i;
      Range=0;
      AvgRange=0;
      for (counter=i ;counter<=i+9;counter++)
      {
         AvgRange=AvgRange+MathAbs(High[counter]-Low[counter]);
      }
      Range=AvgRange/10;

      bool  HiClose = false,
            HiOpen  = false,
            HiWick  = false,
            LoWick  = false;

      if (Open[0]<Close[0])
         HiClose = true;
      else
         HiOpen = true;

      if (HiClose){
         if ((High[0]-Close[0])>(Close[0]-Open[0]) && (High[0]-Close[0])>(Open[0]-Low[0]))
            HiWick = true;
      }
      if (HiOpen){
         if ((High[0]-Open[0])>(Open[0]-Close[0]) && (High[0]-Open[0])>(Close[0]-Low[0]))
            HiWick = true;
      }
      if (HiClose){
         if ((Open[0]-Low[0])>(Close[0]-Open[0]) && (Open[0]-Low[0])>(High[0]-Close[0]))
            LoWick = true;
      }
      if (HiOpen){
         if ((Close[0]-Low[0])>(Open[0]-Close[0]) && (Close[0]-Low[0])>(High[0]-Open[0]))
            LoWick = true;
      }


      if (HiWick) {
         VTop[i] = Low[i] - Range*0.5;
      }
      else if (LoWick) {
         VBottom[i] = High[i] + Range*0.5;
      }
   }
   return(0);
}
Comments