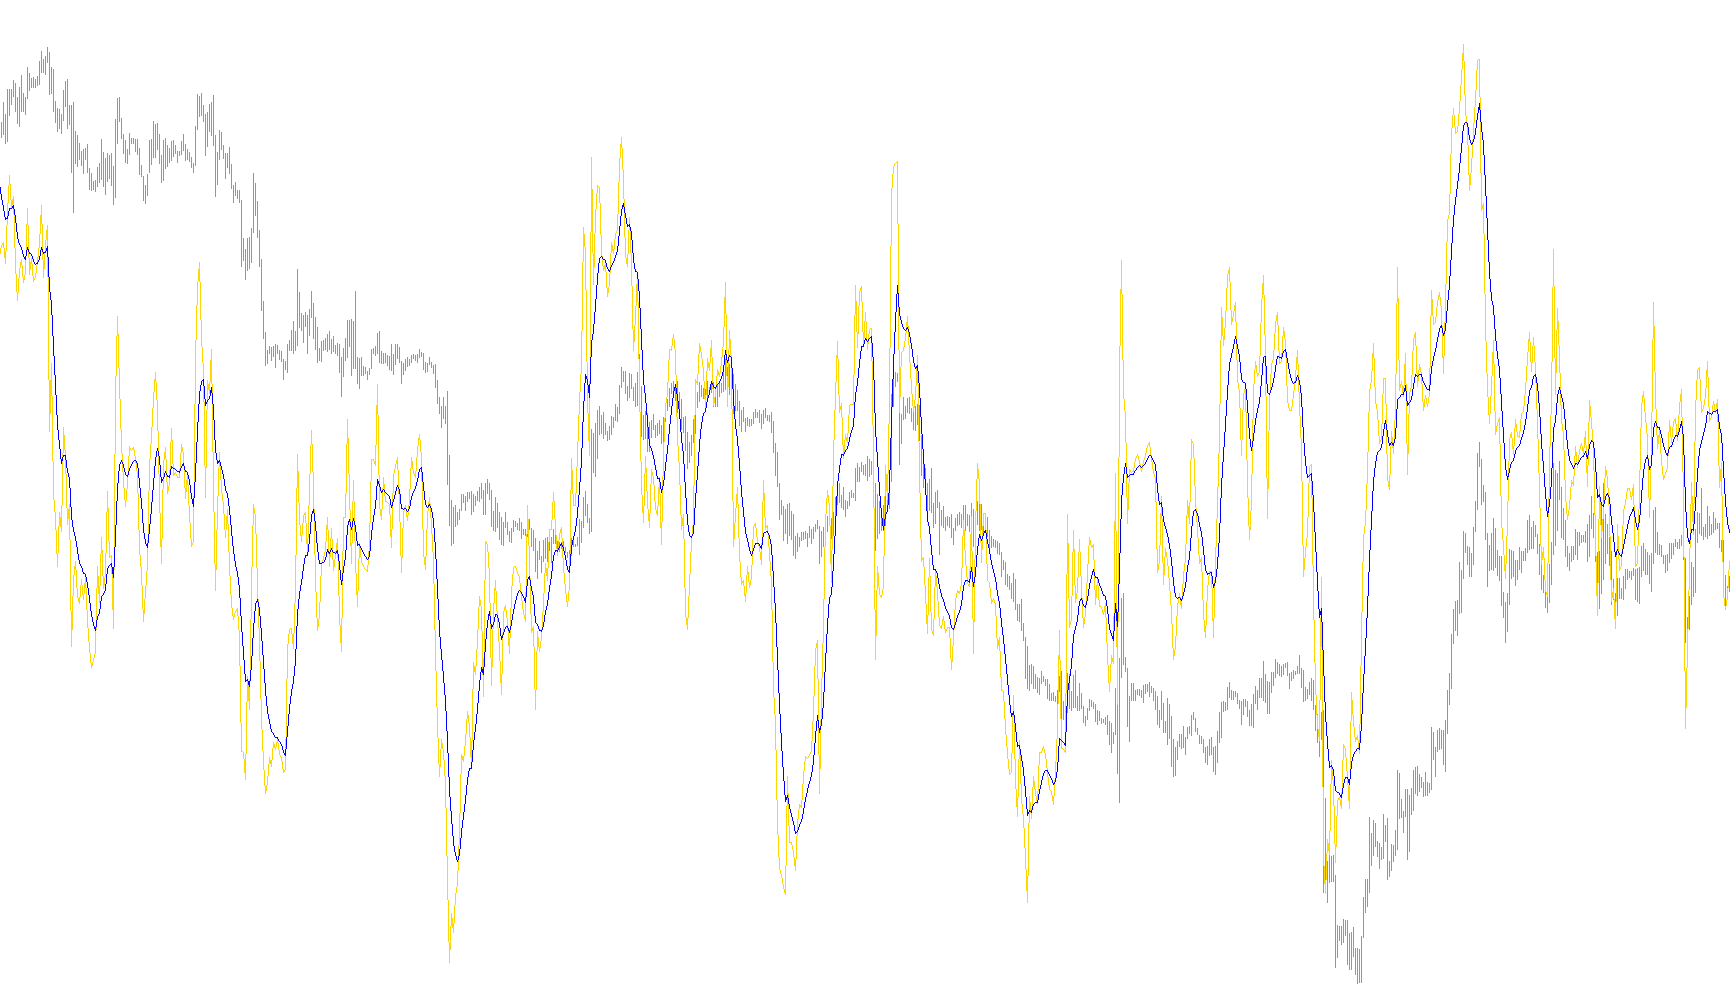
Technical Logic Overview
This script is designed as a multi-timeframe analytical tool for the MetaTrader 4 platform. Its primary purpose is to provide traders with a synchronized "snapshot" of market momentum across multiple timeframes simultaneously within a single window. Instead of requiring a user to switch between different charts to gauge market sentiment, this tool aggregates that data into one visible display.
Core Functional Logic
1. Multi-Timeframe Data Aggregation The script automatically pulls Relative Strength Index (RSI) data from six distinct timeframes:
- 1 Minute (M1)
- 5 Minutes (M5)
- 15 Minutes (M15)
- 30 Minutes (M30)
- 1 Hour (H1)
- 4 Hours (H4)
By gathering this data in real-time, the script allows you to see how the "pulse" of the market differs between short-term scalping intervals and long-term swing trading trends at a single glance.
2. Smoothing and Filtering Raw RSI values can often be volatile and jump quickly, which can lead to "noise" in decision-making. To counteract this, the script applies an Exponential Moving Average (EMA) calculation to the RSI data of every timeframe. This smoothing process helps highlight the underlying trend of the momentum, making it easier to identify sustained movements rather than temporary price fluctuations.
3. Dynamic Visual Display The script features a dedicated visual output layer that renders text labels directly on your chart window. It calculates the specific values for each smoothed RSI and displays them as organized coordinates.
Key features of this display include:
- Customizable Layout: The logic includes a "Side" setting, allowing users to choose whether the timeframe data is displayed from left-to-right or right-to-left (e.g., starting with the highest timeframe vs. the lowest).
- Real-Time Updates: The labels are programmed to refresh automatically, ensuring the numerical values reflect the most current market conditions.
- Visual Organization: It uses specific coordinate positioning (X and Y offsets) and font scaling to ensure the data remains clean and readable without cluttering the actual price action on your main chart.
Summary for the User
Essentially, this tool acts as a "Momentum Dashboard." It looks at several different time horizons at once, smooths out the jagged edges of that data to make it readable, and then prints those values clearly on your screen. This helps you quickly determine if the various market cycles—from the 1-minute "noise" to the 4-hour "trend"—are moving in harmony or in opposition to one another.
//+------------------------------------------------------------------+
//|                                                  Fabularasa.mq4  |
//|                                                      Fabularasa  |
//|                                                                  |
//|                                                                  |
//|   19.jul.2009     - add some extern variabile                    |
//| (Rafaell - okfar) - fixed calculation                            |
//|                   - fixed object ....                            |
//+------------------------------------------------------------------+

#property copyright "Fabularasa"
#property copyright "X"
#property indicator_separate_window
#property indicator_buffers 2
#property indicator_level1 30
#property indicator_level2 70
#property indicator_maximum 100
#property indicator_minimum 0

#property indicator_levelcolor DarkSlateGray
#property indicator_color1 Blue
#property indicator_color2 Gold


extern int RSIPeriod = 14;
extern int MARSIPeriod =8;
extern int ModeMA = MODE_EMA;
extern int fontsize = 10;
extern int Side = 1;
extern int Y = 5;
extern int X = 5;
extern color BarLabel_color = DarkGreen;


extern int barsPerTimeFrame =1000;


double rsi[], ema[],rsiTF1[],
      emaTF1,
      rsiTF5[],
      emaTF5,
      rsiTF15[],
      emaTF15,
      rsiTF30[],
      emaTF30,
      rsiTF1H[],
      emaTF1H,
      rsiTF4H[],
      emaTF4H;
string ind;

int init()
{

if ( barsPerTimeFrame > 3000 ) barsPerTimeFrame = 3000;

  IndicatorBuffers(8);

  SetIndexStyle (0, DRAW_LINE,Blue);
  SetIndexStyle (1, DRAW_LINE,Green);
  SetIndexBuffer(0, rsi);
  SetIndexBuffer(1, ema);
  SetIndexBuffer(2,rsiTF1);
  SetIndexBuffer(3,rsiTF5);
  SetIndexBuffer(4,rsiTF15);
  SetIndexBuffer(5,rsiTF30);
  SetIndexBuffer(6,rsiTF1H);
  SetIndexBuffer(7,rsiTF4H);

  ind = StringConcatenate("!(",RSIPeriod,",",MARSIPeriod,")");
  IndicatorShortName(ind);

  return(0);
}


int deinit()
{
ObjectDelete("NumberRsi");
ObjectDelete("RSI1");
ObjectDelete("RSI5");
ObjectDelete("RSI15");
ObjectDelete("RSI30");
ObjectDelete("RSI1H");
ObjectDelete("RSI4H");

return(0);
}


int start()
{

int limit = Bars;
ArraySetAsSeries(rsi, true);
ArraySetAsSeries(rsiTF1, true);
ArraySetAsSeries(rsiTF5, true);
ArraySetAsSeries(rsiTF15, true);
ArraySetAsSeries(rsiTF30, true);
ArraySetAsSeries(rsiTF1H, true);
ArraySetAsSeries(rsiTF4H, true);


for(int b=0; b<limit-RSIPeriod; b++)
rsi[b] = iRSI(Symbol(),0,RSIPeriod,PRICE_CLOSE,b);

for(int c=0; c<limit-MARSIPeriod-RSIPeriod; c++)
ema[c] = iMAOnArray(rsi,0,MARSIPeriod,0,ModeMA,c);

for(int a1=0; a1<barsPerTimeFrame; a1++)
  {
      rsiTF1[a1] = iRSI(Symbol(),1,RSIPeriod,PRICE_CLOSE,a1);
      rsiTF5[a1] = iRSI(Symbol(),5,RSIPeriod,PRICE_CLOSE,a1);
      rsiTF15[a1] = iRSI(Symbol(),15,RSIPeriod,PRICE_CLOSE,a1);
      rsiTF30[a1] = iRSI(Symbol(),30,RSIPeriod,PRICE_CLOSE,a1);
      rsiTF1H[a1] = iRSI(Symbol(),60,RSIPeriod,PRICE_CLOSE,a1);
      rsiTF4H[a1] = iRSI(Symbol(),240,RSIPeriod,PRICE_CLOSE,a1);
      //rsi[a1] = iRSI(Symbol(),0,14,PRICE_CLOSE,a1);
  }


emaTF1 = iMAOnArray(rsiTF1,0,MARSIPeriod,0,ModeMA,0);
emaTF5 = iMAOnArray(rsiTF5,0,MARSIPeriod,0,ModeMA,0);
emaTF15= iMAOnArray(rsiTF15,0,MARSIPeriod,0,ModeMA,0);
emaTF30= iMAOnArray(rsiTF30,0,MARSIPeriod,0,ModeMA,0);
emaTF1H= iMAOnArray(rsiTF1H,0,MARSIPeriod,0,ModeMA,0);
emaTF4H= iMAOnArray(rsiTF4H,0,MARSIPeriod,0,ModeMA,0);

/*
string EMA1 = emaTF1;
string EMA5 = emaTF5;
string EMA15 = emaTF15;
string EMA30 = emaTF30;
string EMA1H = emaTF1H;
string EMA4H = emaTF4H;
*/

string EMA1 = DoubleToStr(emaTF1,2);
string EMA5 = DoubleToStr(emaTF5,2);
string EMA15 = DoubleToStr(emaTF15,2);
string EMA30 = DoubleToStr(emaTF30,2);
string EMA1H = DoubleToStr(emaTF1H,2);
string EMA4H = DoubleToStr(emaTF4H,2);

/*
if(ObjectFind("RSI1")) {

ObjectDelete("RSI1");
ObjectDelete("RSI5");
ObjectDelete("RSI15");
ObjectDelete("RSI30");
ObjectDelete("RSI1H");
ObjectDelete("RSI4H");
ObjectDelete("RSI11");
ObjectDelete("RSI51");
ObjectDelete("RSI151");
ObjectDelete("RSI301");
ObjectDelete("RSI1H1");
ObjectDelete("RSI4H1");
}
*/
if (Side == 1 || Side == 3)
   Write("NumberRsi", Side, X+(12*fontsize/8), Y, "H4     H1     M30     M15     M5     M1", (fontsize+2), "Tahoma", BarLabel_color);
else
   Write("NumberRsi", Side, X+(12*fontsize/8), Y, "M1     M5     M15     M30     H1     H4", fontsize+2, "Tahoma", BarLabel_color);

//Write("NumberRsi", Side, X+12, Y, "M1     M5     M15     M30     H1     H4", 6, "Tahoma Narrow", BarLabel_color);
Write("RSI1",  Side, X+(5*fontsize/6) , Y+(10*fontsize/6), EMA1,  fontsize, "Tahoma", White);
Write("RSI5",  Side, X+(29*fontsize/6),  Y+(10*fontsize/6), EMA5,  fontsize, "Tahoma", White);
Write("RSI15", Side, X+(51*fontsize/6),  Y+(10*fontsize/6), EMA15, fontsize, "Tahoma", White);
Write("RSI30", Side, X+(74*fontsize/6),  Y+(10*fontsize/6), EMA30, fontsize, "Tahoma", White);
Write("RSI1H", Side, X+(97*fontsize/6),  Y+(10*fontsize/6), EMA1H, fontsize, "Tahoma", White);
Write("RSI4H", Side, X+(120*fontsize/6),  Y+(10*fontsize/6), EMA4H, fontsize, "Tahoma", White);


return(0);
}
//+------------------------------------------------------------------+

void Write(string LBL, double Side, int X, int Y, string text, int fontsize, string fontname, color Tcolor)
{


  ObjectCreate(LBL, OBJ_LABEL, WindowFind(ind), 0 , 0);
  ObjectSetText(LBL,text, fontsize, fontname, Tcolor);
  ObjectSet(LBL, OBJPROP_CORNER, Side);
  ObjectSet(LBL, OBJPROP_XDISTANCE, X);
  ObjectSet(LBL, OBJPROP_YDISTANCE, Y);


}
Comments