VininI ConstTickPrice
Download script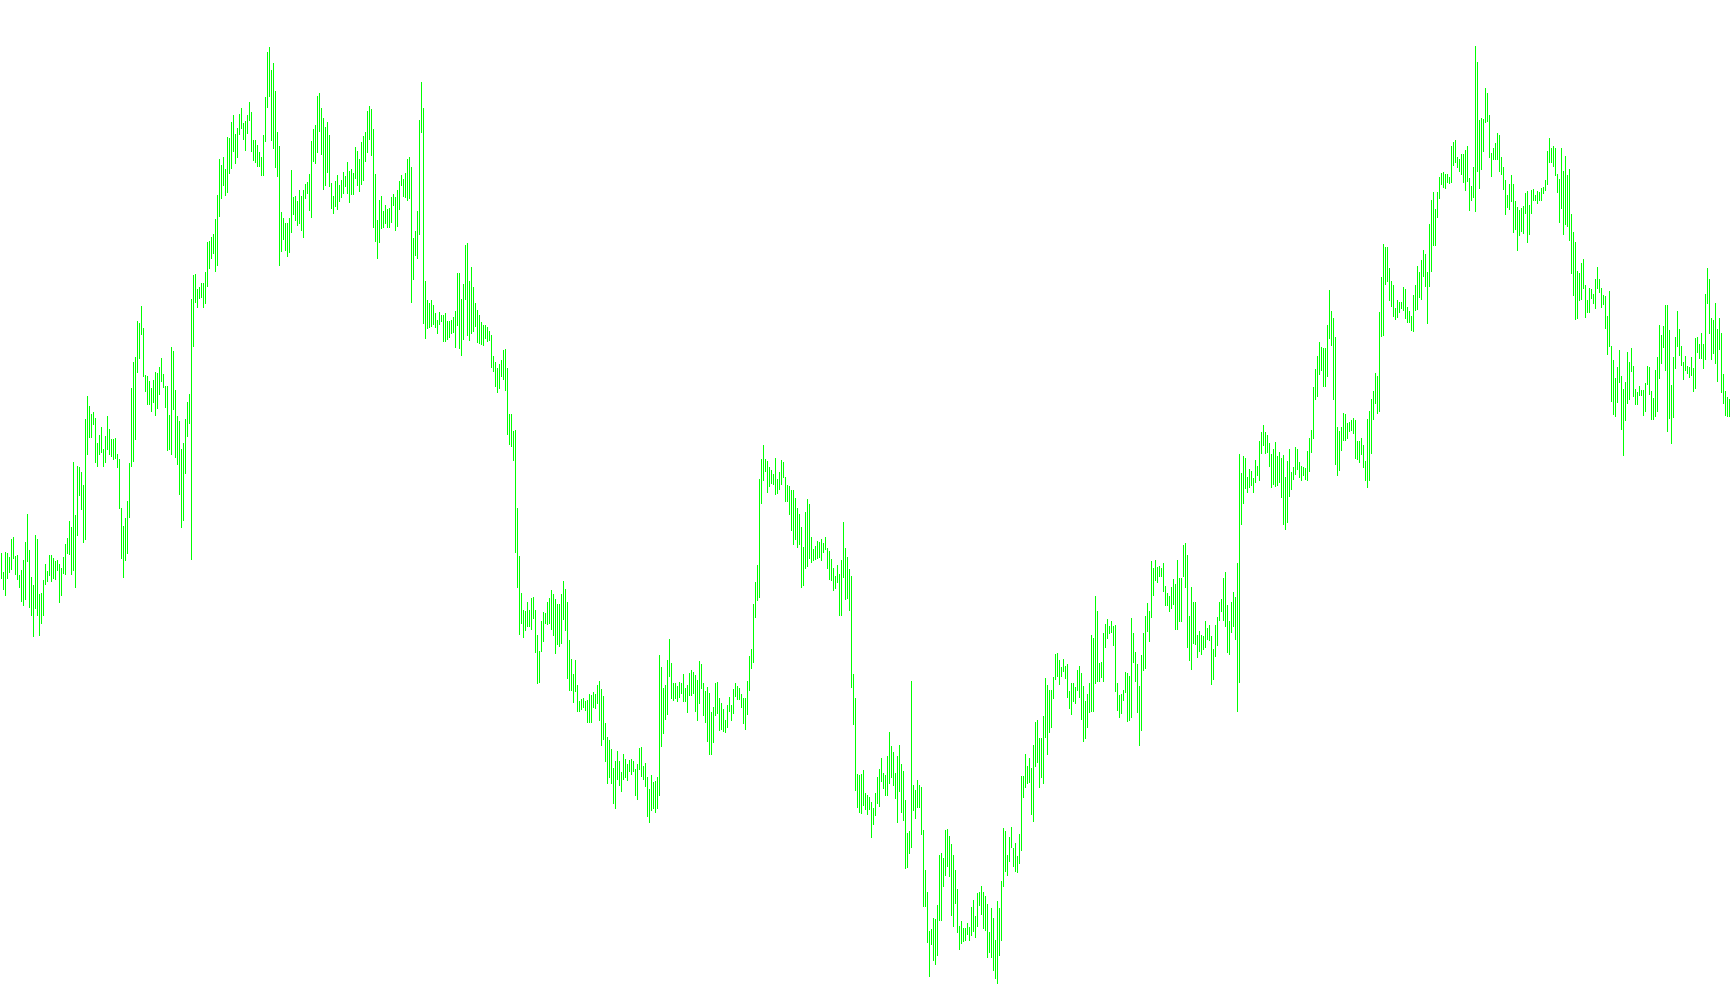
This tool is designed for traders who need to visualize price action based on specific tick-volume thresholds rather than standard time intervals. While traditional charts show data based on fixed periods (like minutes or hours), this script analyzes the relationship between price movement and the actual frequency of transactions (ticks).
Core Logic Overview
The primary purpose of the script is to "re-segment" the chart. It looks at the underlying volume data to identify significant activity points and treats these as the foundation for displaying prices. Instead of simply showing you a line, it calculates specific price points based on how many ticks have occurred within a certain window.
Key Functional Components
-
Dynamic Volume Tracking: The script maintains a running tally of volume and tick counts across the chart. It constantly monitors the flow of data to determine how "active" a specific period is, allowing it to differentiate between high-frequency trading bursts and low-activity periods.
-
Contextual Resets (Weekly and Bar Logic): The script contains built-in intelligence to recognize structural boundaries in trading:
- Weekly Transitions: It detects when a new trading week begins and resets its internal counters, ensuring that the data from the previous week doesn't "bleed" into the analysis of the current week.
- Tick Threshold Monitoring: You can set a specific "Tick Count." The script monitors the volume; if a single bar exceeds this threshold or if the remaining volume in a sequence falls below it, the script triggers a logic reset. This effectively creates "virtual bars" based on activity levels.
-
Customizable Price Calculations: Once the script determines the correct segment of data to display, it offers several mathematical modes to decide which price value to highlight. You can choose from standard metrics like Open, High, Low, or Close, as well as calculated averages such as:
- Median: The midpoint between the high and low.
- Typical: The average of the high, low, and close.
- Weighted: A calculation that gives more significance to the closing price relative to the high and low.
How it Works on Your Chart
When you apply this script, it doesn't just plot a standard line. It evaluates the history of the market:
- It counts the ticks and volume for every point in time.
- It identifies where "breaks" should occur based on your chosen tick settings and weekly boundaries.
- It calculates the specific price value (based on your chosen mode) for those segments.
- It cleans up the visual output so that only the relevant prices are highlighted, providing a clearer picture of price behavior relative to market activity.
//+------------------------------------------------------------------+
//|                                        VininI ConstTickPrice.mq4 |
//|                      Copyright © 2008, Victor Nicolaev aka Vinin |
//|                                            e-mail: vinin@mail.ru |
//+------------------------------------------------------------------+
#property copyright "Copyright © 2008, Victor Nicolaev aka Vinin"
#property link      "e-mail: vinin@mail.ru"


#property indicator_chart_window
#property indicator_buffers 2
#property indicator_color1 White
#property indicator_color2 White

extern int Price_Mode=0;
extern int CountTick=100;
extern bool DrawAll=false;


//---- buffers
double Price[];
double _CountBar[];
double _Volume[];


//+------------------------------------------------------------------+
//| Custom indicator initialization function                         |
//+------------------------------------------------------------------+
int init() {
//---- drawing settings
   int i;
   IndicatorBuffers(3);
   SetIndexStyle(0,DRAW_NONE);
   SetIndexStyle(1,DRAW_NONE);
   if (!SetIndexBuffer(0,Price)) Print("Íåâîçìîæíî èíèöèàëèçèðîâàòü ìàññèâ Price");
   if (!SetIndexBuffer(1,_CountBar)) Print("Íåâîçìîæíî èíèöèàëèçèðîâàòü ìàññèâ CountBar");
   if (!SetIndexBuffer(2,_Volume)) Print("Íåâîçìîæíî èíèöèàëèçèðîâàòü ìàññèâ Volume");

   SetIndexLabel(0,"Price");
   Price_Mode=MathMax(Price_Mode,0);
   Price_Mode=MathMin(Price_Mode,6);
   return(0); }//int init()
//+------------------------------------------------------------------+
int start() {
   int limit;
   int counted_bars=IndicatorCounted();
   int i, pos;
   if(counted_bars<0) return(-1);
   if(counted_bars>0) counted_bars--;
   limit=Bars-counted_bars;
   for (i = limit;i>=0;i--){
      _Volume[i]=_Volume[i+1]+Volume[i];
      _CountBar[i]=_CountBar[i+1]+1;
      CheckWeek(i);
      CheckBar(i);
      CheckTick(i);
      RedRaw(i);


   }
   return(0);
}// int start()

void RedRaw(int pos){
   int i;
   if (!DrawAll) {
      for (i=1;i<=_CountBar[pos];i++) {
         Price[pos+i]=EMPTY_VALUE;
      }
   }
   Price[pos]=fPrice(Price_Mode,pos,_CountBar[pos]);
}

void CheckWeek(int pos){
   if (TimeDayOfWeek(Time[pos+1])>TimeDayOfWeek(Time[pos+0])) {
      _Volume[pos] = Volume[pos];
      _CountBar[pos]   = 0;
      RedRaw(pos+1);
    }
 }

void CheckBar(int pos){
   int tmp0=Ostatok(_Volume[pos+0],CountTick);
   int tmp1=Ostatok(_Volume[pos+1],CountTick);
   if (tmp0<tmp1) {
      if (tmp0>CountTick-tmp1) {
         _CountBar[pos]   = 0;
         RedRaw(pos+1);
      }
      else {
         _CountBar[pos+1] = 0;
         _CountBar[pos]   = 1;
         RedRaw(pos+2);
         RedRaw(pos+1);
      }
   }
}

void CheckTick(int pos) {
   if (Volume[pos]>CountTick) {
      _CountBar[pos]=0;
      RedRaw(pos+1);
   }
}

int Ostatok(double Value1, double Value2){
   double tmp=NormalizeDouble(Value1/Value2,0);
   if (tmp*Value2>Value1) tmp--;
   return(Value1-tmp*Value2);
}

double fPrice(int Price_Mode, int pos, int shift) {
   double   _CLOSE, _OPEN, _HIGH, _LOW, _MEDIAN, _TYPICAL, _WEIGHTED;
   _OPEN=Open[pos+shift];
   if (shift>0) {
      _HIGH=High[iHighest(NULL,0,MODE_HIGH,shift,pos)];
      _LOW=Low[  iLowest( NULL,0,MODE_LOW, shift,pos)];
    }
    else {
      _HIGH=High[pos];
      _LOW=Low[pos];
   }
   _CLOSE=Close[pos];

   _MEDIAN=(_HIGH+_LOW)/2.0;
   _TYPICAL=(_HIGH+_LOW+_CLOSE)/3.0;
   _WEIGHTED=(_HIGH+_LOW+2.0*_CLOSE)/4.0;
   switch (Price_Mode) {
      case PRICE_CLOSE:    return(_CLOSE);
      case PRICE_OPEN:     return(_OPEN);
      case PRICE_HIGH:     return(_HIGH);
      case PRICE_LOW:      return(_LOW);
      case PRICE_MEDIAN:   return(_MEDIAN);
      case PRICE_TYPICAL:  return(_TYPICAL);
      case PRICE_WEIGHTED: return(_WEIGHTED);
   }
   return(0);
}
Comments